
 EUR/USD" border="0" height="722" width="1314">
EUR/USD (daily chart) has been gradually grinding its way higher within a short-term bullish trend that has lasted since the early November low around $1.3300 support.
This bullish run was initiated after the pair plunged from close to a two-year high of $1.3830 in late October down to a low around $1.3300 support (also a key 50% Fibonacci retracement of the prior bullish trend) in early November before rebounding.
The rebound has thus far recovered well more than half of the noted plunge and appears poised for further potential recovery. The 50-day moving average is well above the 200-day moving average, a significantly bullish indication. The key upside objective currently resides around the $1.3700 resistance level, with any further upside potentially seeking a re-test of the noted $1.3830 long-term high. Any breakout above that high could potentially begin targeting $1.4000 and then $1.4250. The key downside support level to watch, especially on a breakdown below $1.3500, currently resides around the $1.3400 price level. 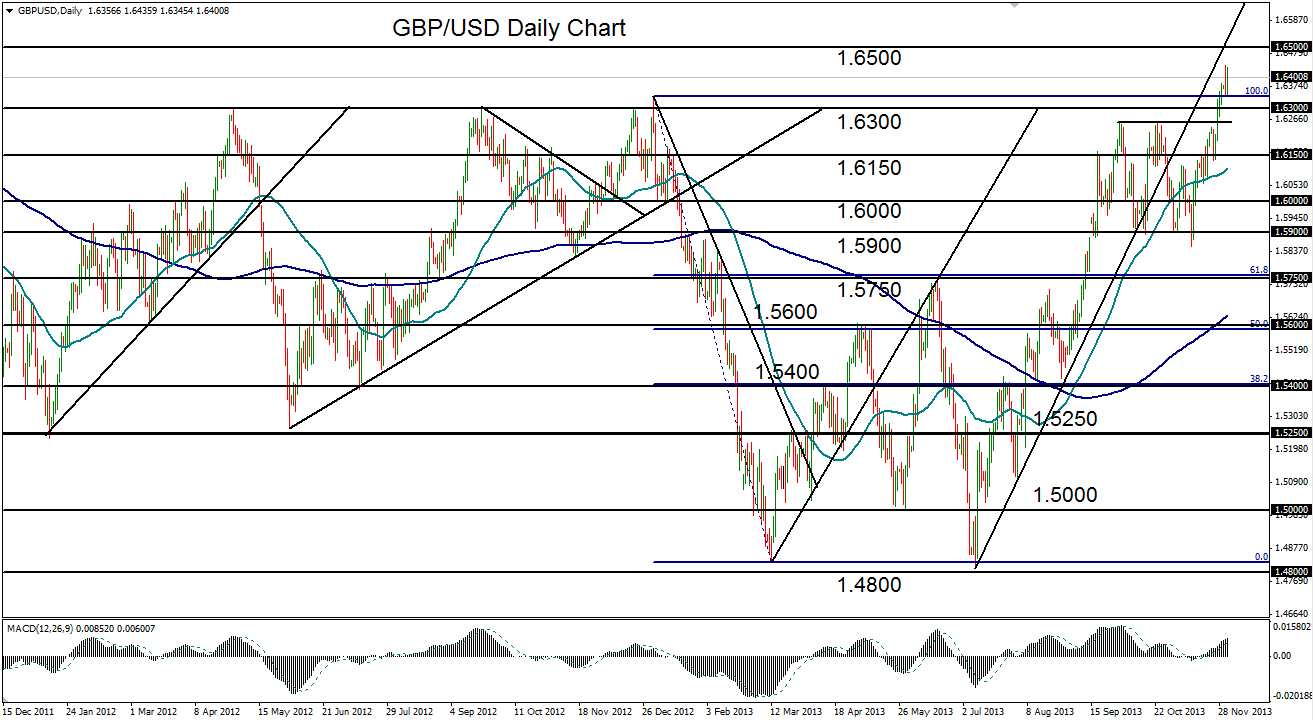 GBP/USD" border="0" height="720" width="1314">
GBP/USD (daily chart) recently made a major breakout above several key resistance levels, including $1.6260 and the major $1.6300 level, disrupting the trading range that had been in place since mid-September. That trading range resided roughly between $1.6260 resistance to the upside and $1.5900-area support to the downside, and was situated at the high end of a long and steep bullish trend extending back to July’s $1.4800-area low.
The recent range breakout above $1.6300 tentatively confirmed a continuation of the bullish trend and put the pair on track to target the $1.6500 and $1.6750 resistance levels to the upside. Major downside support after the breakout of the trading range now resides around the noted $1.6300 broken resistance.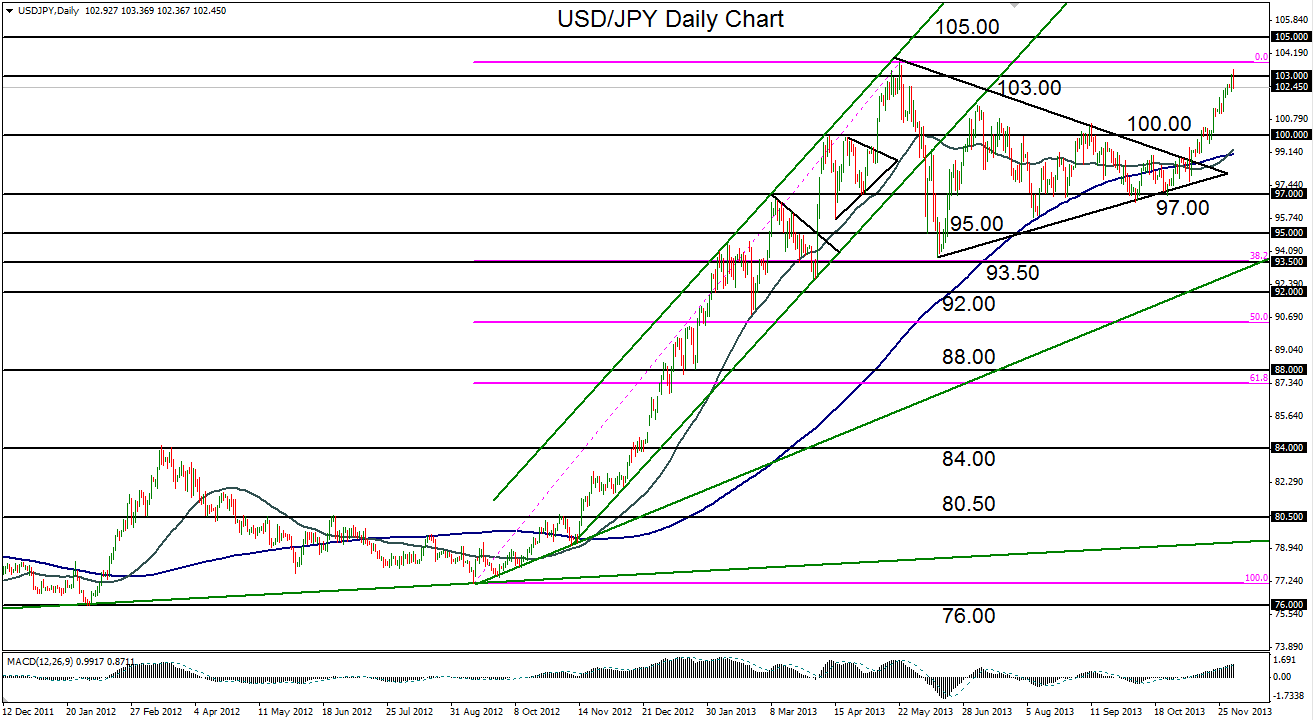 USD/JPY" border="0" height="720" width="1313">
USD/JPY (daily chart) has established a new 6-month high, hitting its intermediate price target at the Y103.00 resistance level. This brings the currency pair close to its multi-year high of Y103.72 that was established in late May, and closer to a confirmed continuation of the bullish trend that has been in place since the September 2012 low near Y77.00.
The current bullish run has been steep and virtually unrelenting since the pair broke out above a large triangle pattern consolidation in early November. That breakout went on to reach its initial target around the key Y100.00 psychological level, and then pushed swiftly higher to its second major target at the Y103.00 resistance level. Currently, the clear subsequent target to the upside is a re-test of the noted Y103.72 high, a breakout above which would finally confirm a continuation of the longstanding uptrend. In that event, further upside resistance targets reside around 105.00 and Y108.00. Tentative downside support currently resides around the Y101.50 level.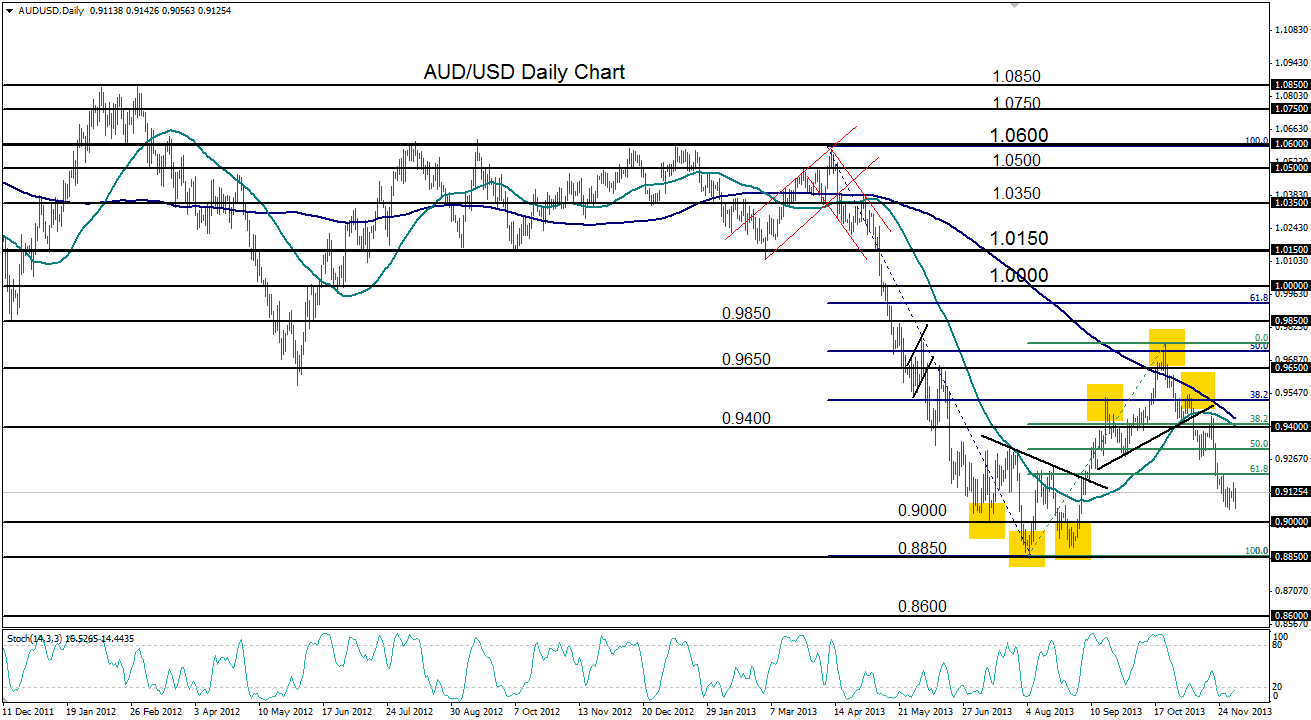 AUD/USD" border="0" height="720" width="1311">
AUD/USD (daily chart) has continued to sustain its dramatic plunge to approach its multi-year depths once again.
The current drop occurs after the pair formed a head-and-shoulders reversal pattern with its late-October high at $0.9757. Shortly after breaking down below the neckline of this reversal pattern in early November, there was a brief pullback to the upside before the pair swiftly began its current slide. With the downside target of the head-and-shoulders pattern having been fulfilled around the $0.9050 level, the directional outlook for AUD/USD continues to be bearish.
Overall, the substantial bullish correction that was halted by the noted head-and-shoulders pattern represented a 50% Fibonacci retracement of the long and steep plummet from April to August.
Currently, clear downside objectives reside around the $0.9000 psychological support level followed by the $0.8850-area multi-year low. Any breakdown activity below the latter level would clearly confirm a continuation of the overall bearish trend, with a further downside target around $0.8600. Key upside resistance currently resides around the $0.9300 level.
Disclosure: FX Solutions assumes no responsibility for errors, inaccuracies or omissions in these materials. FX Solutions does not warrant the accuracy or completeness of the information, text, graphics, links or other items contained within these materials. FX Solutions shall not be liable for any special, indirect, incidental, or consequential damages, including without limitation losses, lost revenues, or lost profits that may result from these materials.
The products offered by FX Solutions are leveraged products which carry a high level of risk to your capital with the possibility of losing more than your initial investment and may not be suitable for all investors. Ensure you fully understand the risks involved and seek independent advice if necessary.
- English (UK)
- English (India)
- English (Canada)
- English (Australia)
- English (South Africa)
- English (Philippines)
- English (Nigeria)
- Deutsch
- Español (España)
- Español (México)
- Français
- Italiano
- Nederlands
- Português (Portugal)
- Polski
- Português (Brasil)
- Русский
- Türkçe
- العربية
- Ελληνικά
- Svenska
- Suomi
- עברית
- 日本語
- 한국어
- 简体中文
- 繁體中文
- Bahasa Indonesia
- Bahasa Melayu
- ไทย
- Tiếng Việt
- हिंदी
EUR/USD: On The Path To Further Gains?
Published 12/04/2013, 08:52 AM
Updated 07/09/2023, 06:31 AM
EUR/USD: On The Path To Further Gains?
3rd party Ad. Not an offer or recommendation by Investing.com. See disclosure here or
remove ads
.
Latest comments
Install Our App
Risk Disclosure: Trading in financial instruments and/or cryptocurrencies involves high risks including the risk of losing some, or all, of your investment amount, and may not be suitable for all investors. Prices of cryptocurrencies are extremely volatile and may be affected by external factors such as financial, regulatory or political events. Trading on margin increases the financial risks.
Before deciding to trade in financial instrument or cryptocurrencies you should be fully informed of the risks and costs associated with trading the financial markets, carefully consider your investment objectives, level of experience, and risk appetite, and seek professional advice where needed.
Fusion Media would like to remind you that the data contained in this website is not necessarily real-time nor accurate. The data and prices on the website are not necessarily provided by any market or exchange, but may be provided by market makers, and so prices may not be accurate and may differ from the actual price at any given market, meaning prices are indicative and not appropriate for trading purposes. Fusion Media and any provider of the data contained in this website will not accept liability for any loss or damage as a result of your trading, or your reliance on the information contained within this website.
It is prohibited to use, store, reproduce, display, modify, transmit or distribute the data contained in this website without the explicit prior written permission of Fusion Media and/or the data provider. All intellectual property rights are reserved by the providers and/or the exchange providing the data contained in this website.
Fusion Media may be compensated by the advertisers that appear on the website, based on your interaction with the advertisements or advertisers.
© 2007-2024 - Fusion Media Limited. All Rights Reserved.