
EUR/USD: Market Shrugged Off Strong US Jobs Report And Still Does Not Believe In June Hike
- The Labor Department said US nonfarm payrolls rose by 215k last month and the unemployment rate edged up to 5.0% from an eight-year low of 4.9%. The market had forecast nonfarm payrolls increasing 205k in March and the unemployment rate holding steady at 4.9%. The economy created 1k fewer jobs in January and February than previously reported.
- The jobless rate increased as more people continued to enter or re-enter the labor market, a sign of confidence in the job market.
- Wages increased last month, with average hourly earnings rising 0.3%. That lifted the year-on-year earnings gain to 2.3% from 2.2% in February.
- Employment gains in March were broad-based. Manufacturing, however, lost 29,000 jobs, the most since December 2009, despite signs of stabilization in the factory sector. The labor market has largely shrugged off slowing global economic growth, a robust USD that has hurt manufacturing exports and the drag on energy sector profits from cheap oil.
- Friday's firm US jobs report failed to shift the broadly held view that the Federal Reserve will remain cautious on interest rate hikes this year.
- Other data on Friday showed manufacturing activity expanded in March for the first time in six months as new orders surged, suggesting the worst of the factory rout was over. The ISM said its index of national factory activity rose 2.3 points to a reading of 51.8 in March.
- Financial markets see a 27% chance of a hike at the Fed's June policy meeting, a 52% chance of such a move in September and a 65% probability at the December meeting. In our opinion the likelihood of June hike is much higher than currently priced in by the market. The next policy meeting is set for April 26-27, followed by one June 14-15.
- Cleveland Fed President Loretta Mester said it is unclear whether the economy will be ready for an interest rate hike by the end of the month. She suggested the Fed should still raise interest rates gradually this year. She added: “Waiting until every piece of data lines up in the correct way means waiting too long and risks having to move rates up more aggressively in the future, with negative impacts on our economy.”
- Recent signs of inflation and robustness in the labor market, including strong job gains in March, have encouraged Mester and a handful of her colleagues to predict more tightening is around the corner. Yet earlier this week, Fed Chair Janet Yellen pushed back with cautious comments on looming risks to the US economy. Published forecasts by Fed officials last month suggested two more rate rises were on the way this year.
- The data from the Commodity Futures Trading Commission released on Friday showed speculators slashed their bullish bets on the dollar for a fourth straight week, with net long positions falling to their lowest in nearly two years.
- In our opinion there is scope for further gains in the EUR/USD in the near term. Technical analysis supports such a view. Tenkan and kijun lines are positively aligned, reinforcing the overall upside potential. We keep our long position unchanged. However, we may see some hawkish comments from Fed policymakers soon and we expect a hawkish Fed statement after April meeting that will be preparing the market for a June hike. That is why we may see some corrective moves on the EUR/USD later this month.
AUD/USD: All Eyes On RBA Statement
- Monday's survey from the Melbourne Institute showed consumer prices were flat in March, after falling 0.2% in February. The annual pace slowed to 1.7%, from 2.1%, taking it back below the RBA's long term target band of 2 to 3%. A measure of underlying inflation pressure, the trimmed mean, also slowed to 1.6% from 1.7%. The official consumer price index for the first quarter is due later this month and a very low reading for underlying inflation could add to the case for a rate cut at the central bank's May meeting.
- Australian job advertisements in newspapers and on the Internet inched ahead in March, a potential sign demand for labour had peaked after a very strong 2015. A monthly survey by Australia and New Zealand Banking Group showed total job advertisements rose 0.2% to 155,108 per week on average in March, from February when they fell 1.2%. Ads were still 10.0% higher on March last year.
- Official measures of employment surprised with their strength for much of last year but have softened in the past few months. The jobless rate has been mostly steady around 6%. The Reserve Bank of Australia has cited the resilience of employment as an argument against the need for further cuts in interest rates.
- Retail sales in Australia remained unchanged from a month earlier in February, following a 0.3% rise in January and below market expectations of a 0.4% increase.
- The market is focused on RBA statement on Tuesday (04:30 GMT). The central bank is widely expected to keep the cash rate at a record low 2% on Tuesday and signal there is scope to ease further if needed. We expect monetary policy to remain unchanged and the statement to retain roughly the same tone as that of previous statement. However, risks have increased on the dovish side as trade-weighted AUD appreciation has been stronger than the trade-weighted USD decline.
- Let’s take a look at the AUD/USD daily chart. A long lower wick formed on the daily candle and the pair went up on Friday, which suggested a bullish near-term outlook. But the AUD/USD is falling today and testing the support level at 7-day exponential moving average.
FOREX - MAJOR PAIRS: 
FOREX - MAJOR CROSSES: 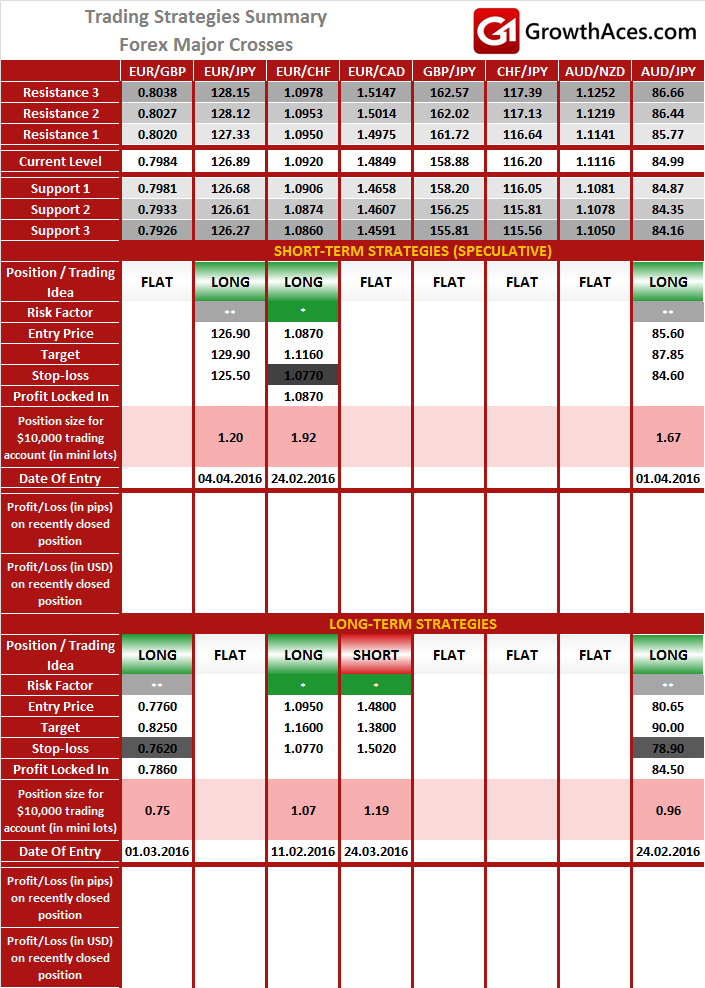
PRECIOUS METALS: 
It is usually reasonable to divide your portfolio into two parts: the core investment part and the satellite speculative part. The core part is the one you would want to make profit with in the long-term thanks to the long-term trend in price changes. Such an approach is a clear investment as you are bound to keep your position opened for a considerable amount of time in order to realize the profit. The speculative part is quite the contrary. You would open a speculative position with short-term gains in your mind and with the awareness that even though potentially more profitable than investments, speculation is also way more risky. In typical circumstances investments should account for 60-90% of your portfolio, the rest being speculative positions. This way, you may enjoy a possibly higher rate of return than in the case of putting all of your money into investment positions and at the same time you may not have to be afraid of severe losses in the short-term.
How to read these tables?
1. Support/Resistance - three closest important support/resistance levels
2. Position/Trading Idea:
BUY/SELL - It means we are looking to open LONG/SHORT position at the Entry Price. If the order is filled we will set the suggested Target and Stop-loss level.
LONG/SHORT - It means we have already taken this position at the Entry Price and expect the rate to go up/down to the Target level.
3. Stop-Loss/Profit Locked In - Sometimes we move the stop-loss level above (in case of LONG) or below (in case of SHORT) the Entry price. This means that we have locked in profit on this position.
4. Risk Factor - green "*" means high level of confidence (low level of uncertainty), grey "**" means medium level of confidence, red "***" means low level of confidence (high level of uncertainty)
5. Position Size (forex)- position size suggested for a USD 10,000 trading account in mini lots. You can calculate your position size as follows: (your account size in USD / USD 10,000) * (our position size). You should always round the result down. For example, if the result was 2.671, your position size should be 2 mini lots. This would be a great tool for your risk management!
Position size (precious metals) - position size suggested for a USD 10,000 trading account in units. You can calculate your position size as follows: (your account size in USD / USD 10,000) * (our position size).
6. Profit/Loss on recently closed position (forex) - is the amount of pips we have earned/lost on recently closed position. The amount in USD is calculated on the assumption of suggested position size for USD 10,000 trading account.
Profit/Loss on recently closed position (precious metals) - is profit/loss we have earned/lost per unit on recently closed position. The amount in USD is calculated on the assumption of suggested position size for USD 10,000 trading account.
Source: Growth Aces - Forex And Precious Metals Trading Strategies