Market Brief
EUR/USD’s price action has been flat for the last two days as the US headed into the Thanksgiving holiday. US markets will be open today but the session will be short. However, mounting uncertainties about the outcome of the next ECB meeting on December 3rd have translated into the derivative market. The one-week implied volatility on EUR/USD soared to levels last seen in July - when Greece was in the eye of the storm - jumping to 16% compared to 9.40% on Wednesday. On the spot market, we believe that EUR/USD will tread water as investors save some strength for next week big events (ECB meeting; ISM, ADP and NFP in the US).

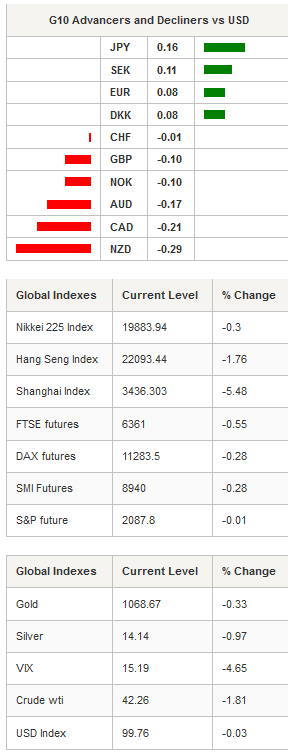
In Japan, the unemployment rate fell to a 20-year low, to 3.1% in October from 3.4% in the previous month. This strong reading should prevent the BoJ from using a more hawkish language, keeping monetary policy on hold. However the picture is not very bright as inflation remained subdued in October, in spite of Kuroda’s unshakable optimism. Headline inflation came in at 0.3%y/y, beating expectations of 0.2% and previous reading of 0.0%. However, nationwide core CPI (i.e. Ex Fresh food) remained at -0.1%m/m, matching median forecast, while the Ex food and Ex energy gauge fell to 0.7%y/y from 0.9% in September, missing median forecast of 0.8%. The Japanese yen strengthen against the US dollar with USD/JPY sliding to the bottom of its weekly range at around 122.30.
On the equity front, equities were heavily sold off in the Asian session as poor data from Japan weighed on investor moods while a few brokerages are being investigated after rumours of violations in securities regulation. The Japanese Nikkei was down 0.30%, while the broader TOPIX index dropped 0.49%. In Hong Kong the Hang Seng paired losses, down 1.76%. Mainland Chinese stocks were the biggest losers of the Asian session with the Shanghai Composite and the Shenzhen Composite erasing 5.48% and 6.09%. Finally, in Singapore, equities were down 1.20%, while in South Korea the Kospi edged down 0.08%.
Commodity currencies were the biggest losers on the FX market as commodity prices dipped lower. Gold is down -0.33%, silver -0.97%, while natural gas fell 2.65%. Crude oil prices were also under heavy selling pressure with the West Texas Intermediate sliding 1.88%, while its counterpart from the North Sea edged down 0.81%.
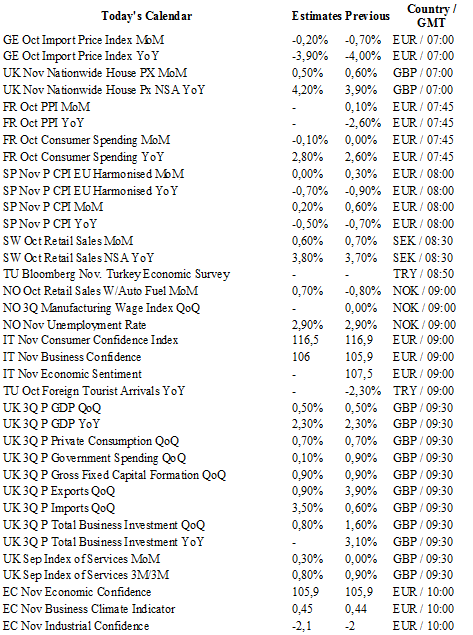
Today traders will be watching inflation report from Spain; retail sales from Sweden; unemployment rate from Norway; consumer confidence from Italy; Q3 GDP growth from United Kingdom; consumer confidence from euro zone; mid-month inflation report from Brazil; Gfk consumer confidence from Germany.

Currency Tech
EUR/USD
R 2: 1.1387
R 1: 1.1095
CURRENT: 1.0615
S 1: 1.0458
S 2: 1.0000
GBP/USD
R 2: 1.5659
R 1: 1.5529
CURRENT: 1.5087
S 1: 1.5027
S 2: 1.4566
USD/JPY
R 2: 135.15
R 1: 125.86
CURRENT: 122.38
S 1: 120.07
S 2: 118.07
USD/CHF
R 2: 1.1138
R 1: 1.0676
CURRENT: 1.0236
S 1: 0.9739
S 2: 0.9476
