The S&P 500 Futures futures market has an ioi sell signal on the monthly chart and a parabolic wedge buy signal on the daily chart. The Emini should bounce next week, but it also should fall below the October low at some point in November.
Bond futures are turning down from a lower high after an extreme buy climax on the monthly chart. They should trade at least a little lower next week. But because they are near the June low at the bottom of a 7-month trading range, they might turn up for a few weeks soon. It’s a trading range. Nobody expects much.
The EUR/USD Forex market has an ioi sell signal on the monthly chart and a wedge top on the weekly chart. The sell-off should continue to at least the March 9 high, which was the breakout point of the summer rally.
30 year Treasury Bond futures
Bond futures monthly chart is turning down from lower high
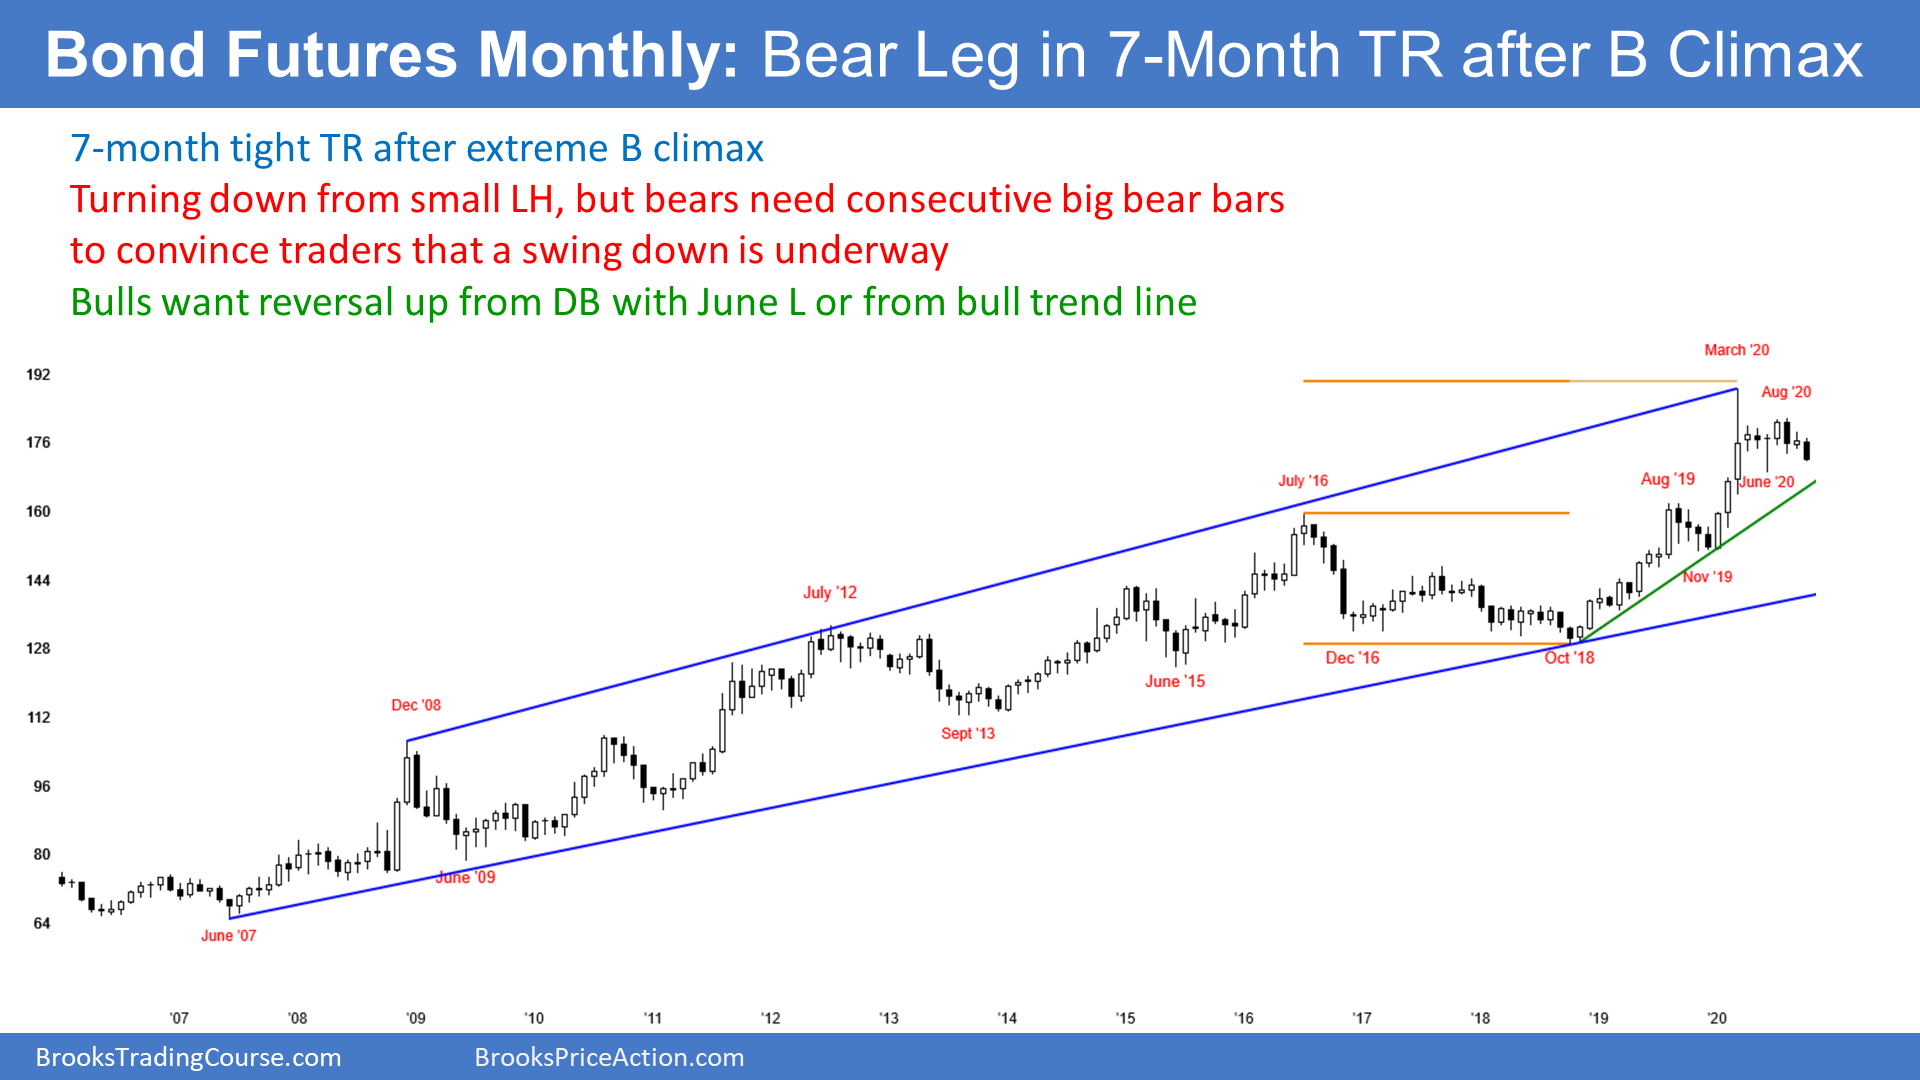
The monthly bond futures chart has gone sideways for 7 months after a reversal down in March from the most extreme buy climax in history. Since March, I have been saying that the most likely thing to happen would be that the monthly chart would enter a tight trading range and that it could last a year or more.
While the monthly bonds have traded down for 3 months, they are still in the 7-month tight trading range. Furthermore, there have not been consecutive strong trend bars up or down since March. In fact, there have not been even consecutive weak trend bars in the same direction.
There is no sustained buying or selling. Traders continue to look for the market to trade down for a few weeks and then up for a few weeks. Traders need more information before they will be willing to hold for a trend.
Consecutive closes far above or below the trading range would convince many traders that a trend has begun. That can happen at any point, but there is currently no evidence that it is about to happen. In the meantime, traders will continue to bet on reversals and take quick profits.
Trading range is Breakout Mode
Every trading range eventually breaks into a trend. The trend can be up or down.
Every trading range is a Breakout Mode pattern. There are always both reasonable buy and sell setups.
The bulls look at the chart and see a bull flag. They expect the bull trend to resume before too long. On a fundamental basis, they are concerned about the world’s economy, especially in light of the pandemic. That makes them think that U.S. interest rates at some point will go negative. They won’t.
However, the bears see a pause after a strong reversal down from an extreme buy climax. They believe that the high is in and that the bond market will work lower for the next decade. That means higher long-term interest rates.
The bears are right. Bonds will be lower 5 and 10 years from now. But what is the path? They could test to above the March high before there is a clear bear trend. It’s like you taking an airport shuttle from a hotel in Times Square to JFK. You know that you will get there, but you might go in the opposite direction one or more times as the bus picks up additional passengers at other hotels. But you will end up at JFK. And bonds will go down.
EUR/USD Forex market
EUR/USD monthly chart has an ioi sell signal
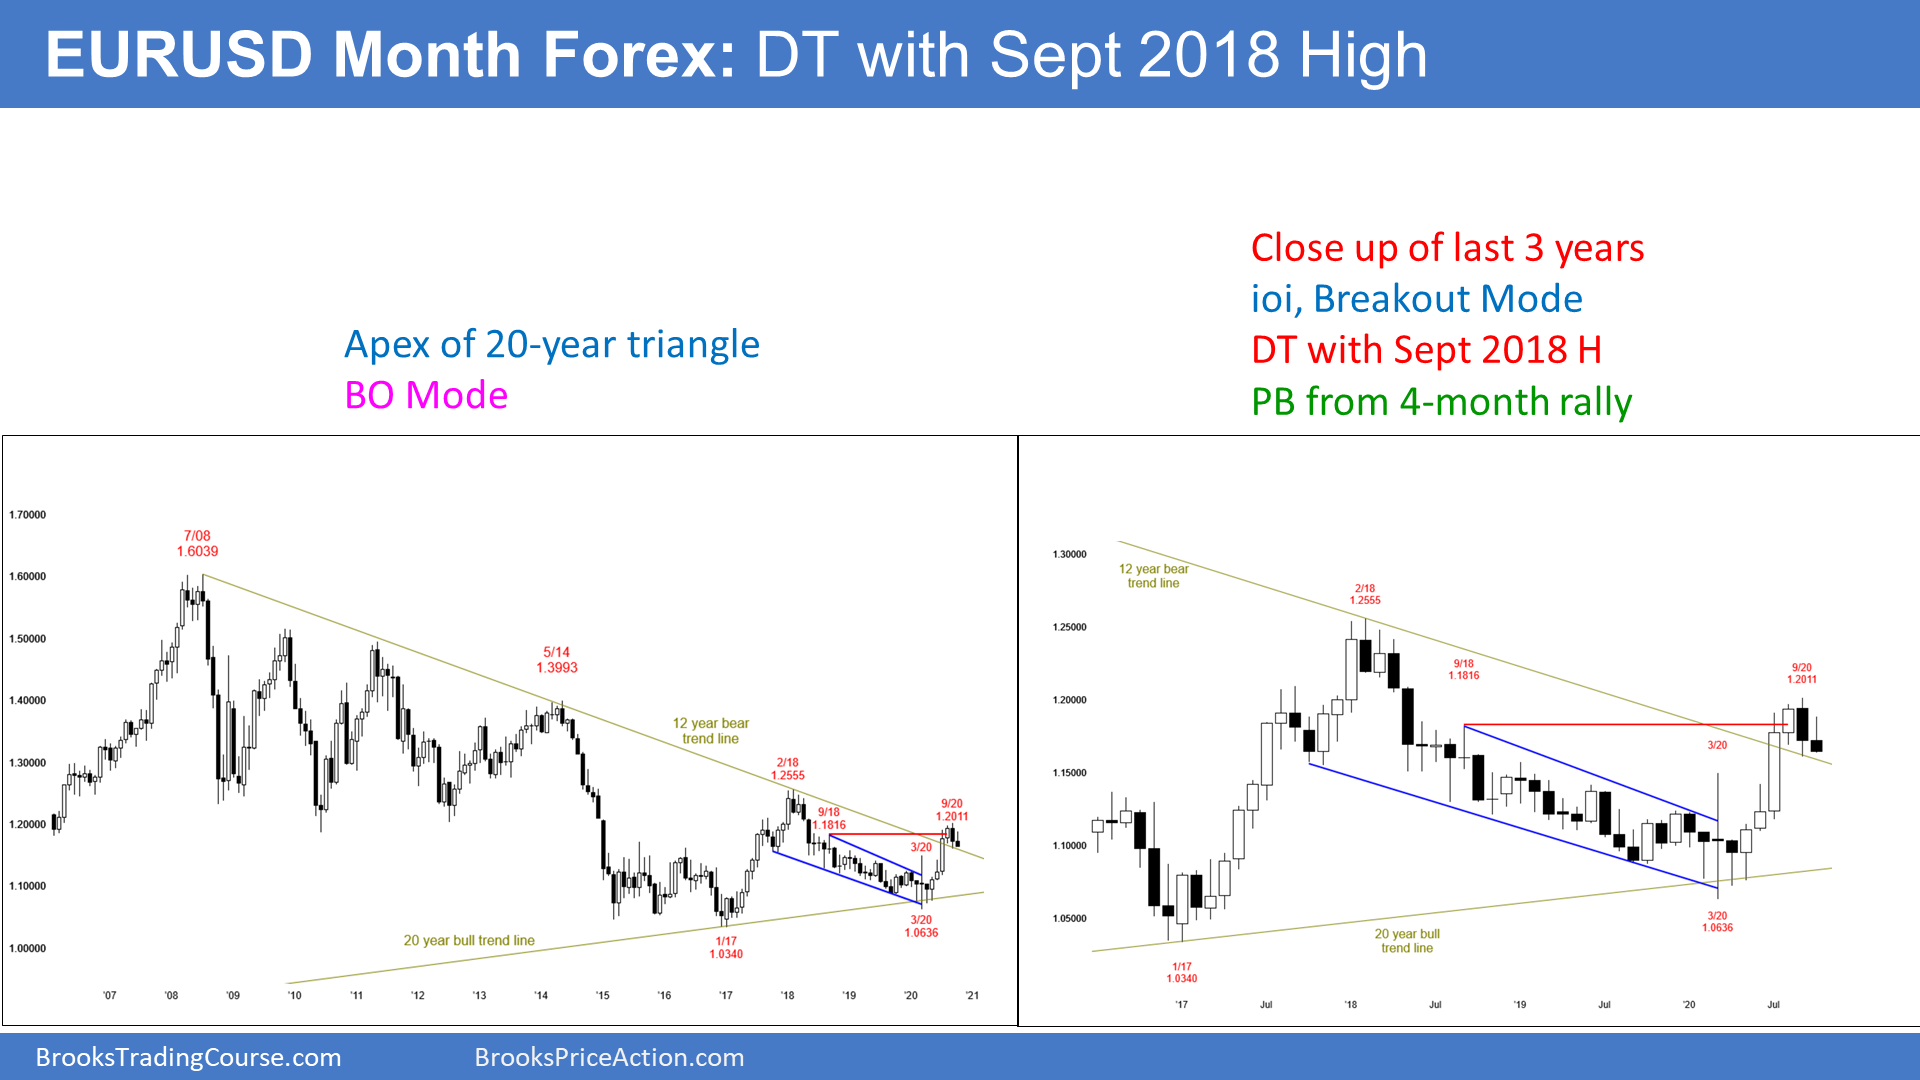
The EUR/USD Forex market on the monthly chart was in a bear trend from February 2018 to March 2020. There was a 2-month spike down (bear trend reversal) in April and May 2018 and then a 2-year bear channel.
The September 2018 high was the 1st pullback from the spike down and it was therefore the start of the bear channel. For the past year, I have been saying that there eventually would be a rally back to that September high, and that the monthly chart would then transition into a trading range. Furthermore, I said that the trading range could last for many months or even more than a year.
The EUR/USD rallied strongly for 4 months this summer and stopped exactly at the September 2018 high, which was likely. It has now gone sideways for 3 months, oscillating around that major resistance. This is probably the start of the developing trading range, and this area should be the top of the range.
ioi Breakout Mode pattern
Last month, September, was an outside down month. October was an inside month. This is therefore an ioi pattern (inside-outside-inside) on the monthly chart. This is a Breakout Mode pattern.
The bulls see October as a High 1 bull flag, which is a pullback in a bull trend. They want the summer rally to resume.
But the bears see October as a second sell signal bar at resistance. A 2nd reversal down from the top of a trading range is a higher probability setup.
August was the 1st sell signal bar, but it was the 4th consecutive bull bar. I said in August that there would be buyers below the August low. But I also said that the rally would only last a month or two before the bears would try again. The bears expect the EUR/USD to turn down from the top of its developing trading range, and stay between 1.06 to 1.20 for at least several more months.
While a Breakout Mode pattern is generally a 50 – 50 bet, the bears have a slight edge here. This is because the EUR/USD monthly chart is so far following the typical Spike and Bear Channel sequence. That makes it likely to continue to follow it. It should turn down from the September 2018 high and go sideways for many months.
EUR/USD weekly chart is turning down from a lower high after a wedge top
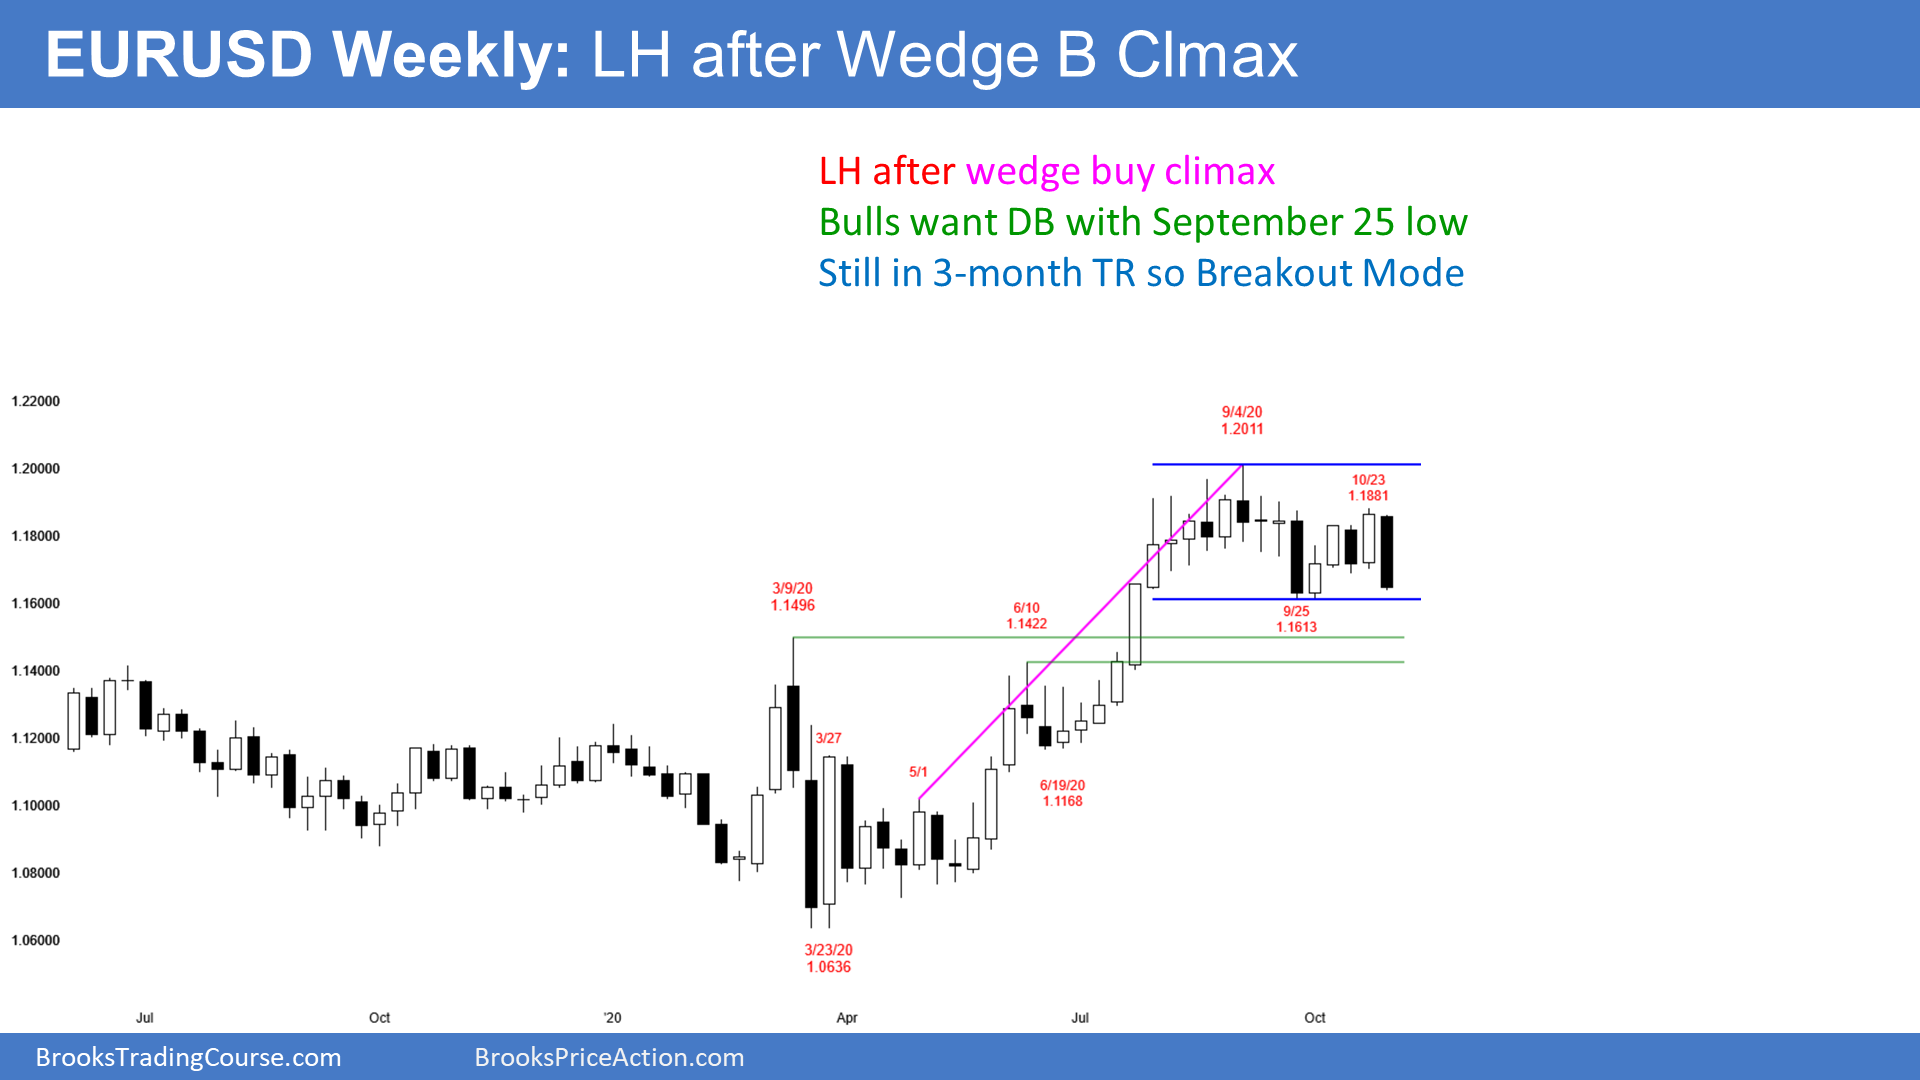
I am writing mostly about the monthly chart this week. However, I want to show the wedge rally on the weekly chart and how it stopped at the September 2018 resistance.
I have been saying that there should be a couple legs down to at least the breakout point of the summer rally. That is the March high, just below 1.15. The reversal might continue down to the June low, which was the start of the final leg up in the wedge.
S&P500 Emini futures
Yearly S&P cash index chart is an outside bar and a doji
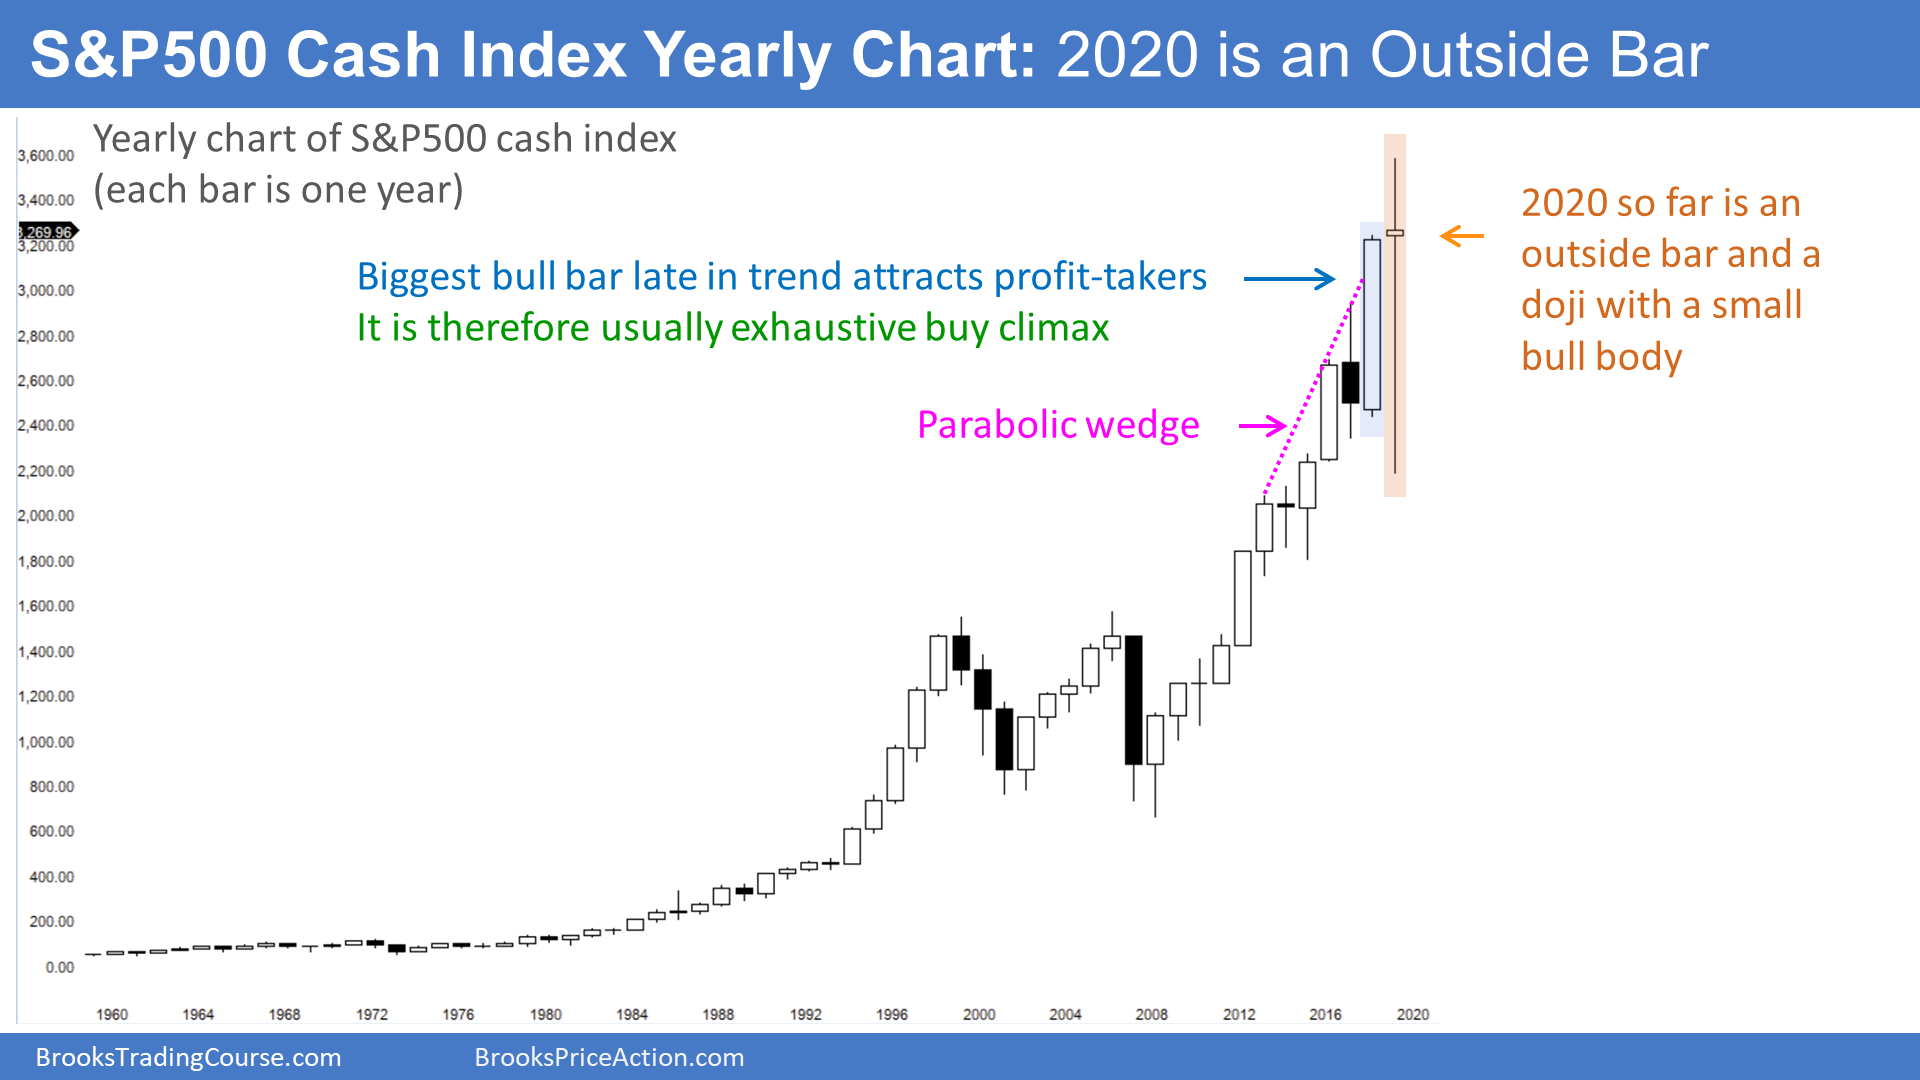
I last showed the yearly S&P500 cash index chart in early January. At that time, I said that 2020 would probably not be a big bull bar because 2019 was a very big bar and it was late in a bull trend. That is usually an exhaustive buy climax. Also, there is a parabolic wedge buy climax on the yearly chart, which is another exhaustion pattern. Markets tend to stall when they become exhausted.
Big bars late in a bull trend typically attract profit-takers. That is why I wrote at the end of last year that 2020 would probably be sideways. Did I know it would go below the 2019 low and above the 2019 high and form an outside bar? No, but I thought that was possible.
Look at this year’s candlestick and what do you see? There are 2 months left to the year and it could look very different at the end of the year. But so far, 2020 is a huge bar with the current close near the open of the year. It is therefore just a big doji bar, which is a 1-bar trading range. That makes sense because the S&P cash index and the Emini are clearly in trading ranges on the weekly chart.
Magnets are important just before a bar closes
When a bar is about to close, traders pay attention to magnets, which are nearby support and resistance levels. On the yearly chart, some magnets are the highs and lows of the bar before, and of the current bar. Another is the close of bar before, which is the close of 2019. Will 2020 close above the close of last year, which would make 2020 an up year?
This chart is the cash index, but the Emini is the futures market equivalent and it is very similar. It only goes back to 1997 and that is why I am showing the chart of the cash index.
What is the most important price for the remainder of 2020?
It is unlikely that the Emini will close at the low of the year. But there is one other magnet that might be the most important: the open of the year. If 2020 closed very near the open, the year would be a perfect doji bar, which is neutral.
The year opened at 3214.50. Since that is only 50 points below the current price, it certainly is within reach over the next two months. Of all of the possible yearly magnets, that is probably the most important.
If the Emini is within 100 points of that price in the final week of the year, it will probably get drawn to it. If the year closes within 50 points or so of the open of the year, 2020 would then remain a doji bar. That would increase the chance of more sideways trading in 2021.
Finally, when there is an outside bar late in a bull trend at the top of a buy climax, the next bar typically will not go far above it, if it goes above it at all. Therefore, 2021 will probably not be a strong year.
More likely, it will be sideways and maybe down. It would then be the 4th year in a trading range. Also, the bar after a huge outside bar often is an inside bar. If that happens here, then 2021 would not trade below this year’s low or above this year’s high.
3-year trading range might continue for a decade
Remember, since 2017, I have been saying that the Emini would probably be sideways for about a decade. This is because the 10-year rally was extreme and it takes about a decade for the fundamentals to catch up to the price.
Look back at the strong rallies in 1960’s and the 1990’s. Both led to a decade of sideways trading, and both trading ranges had at least a couple pullbacks of 40 to 70%.
Monthly Emini chart has ioi sell signal
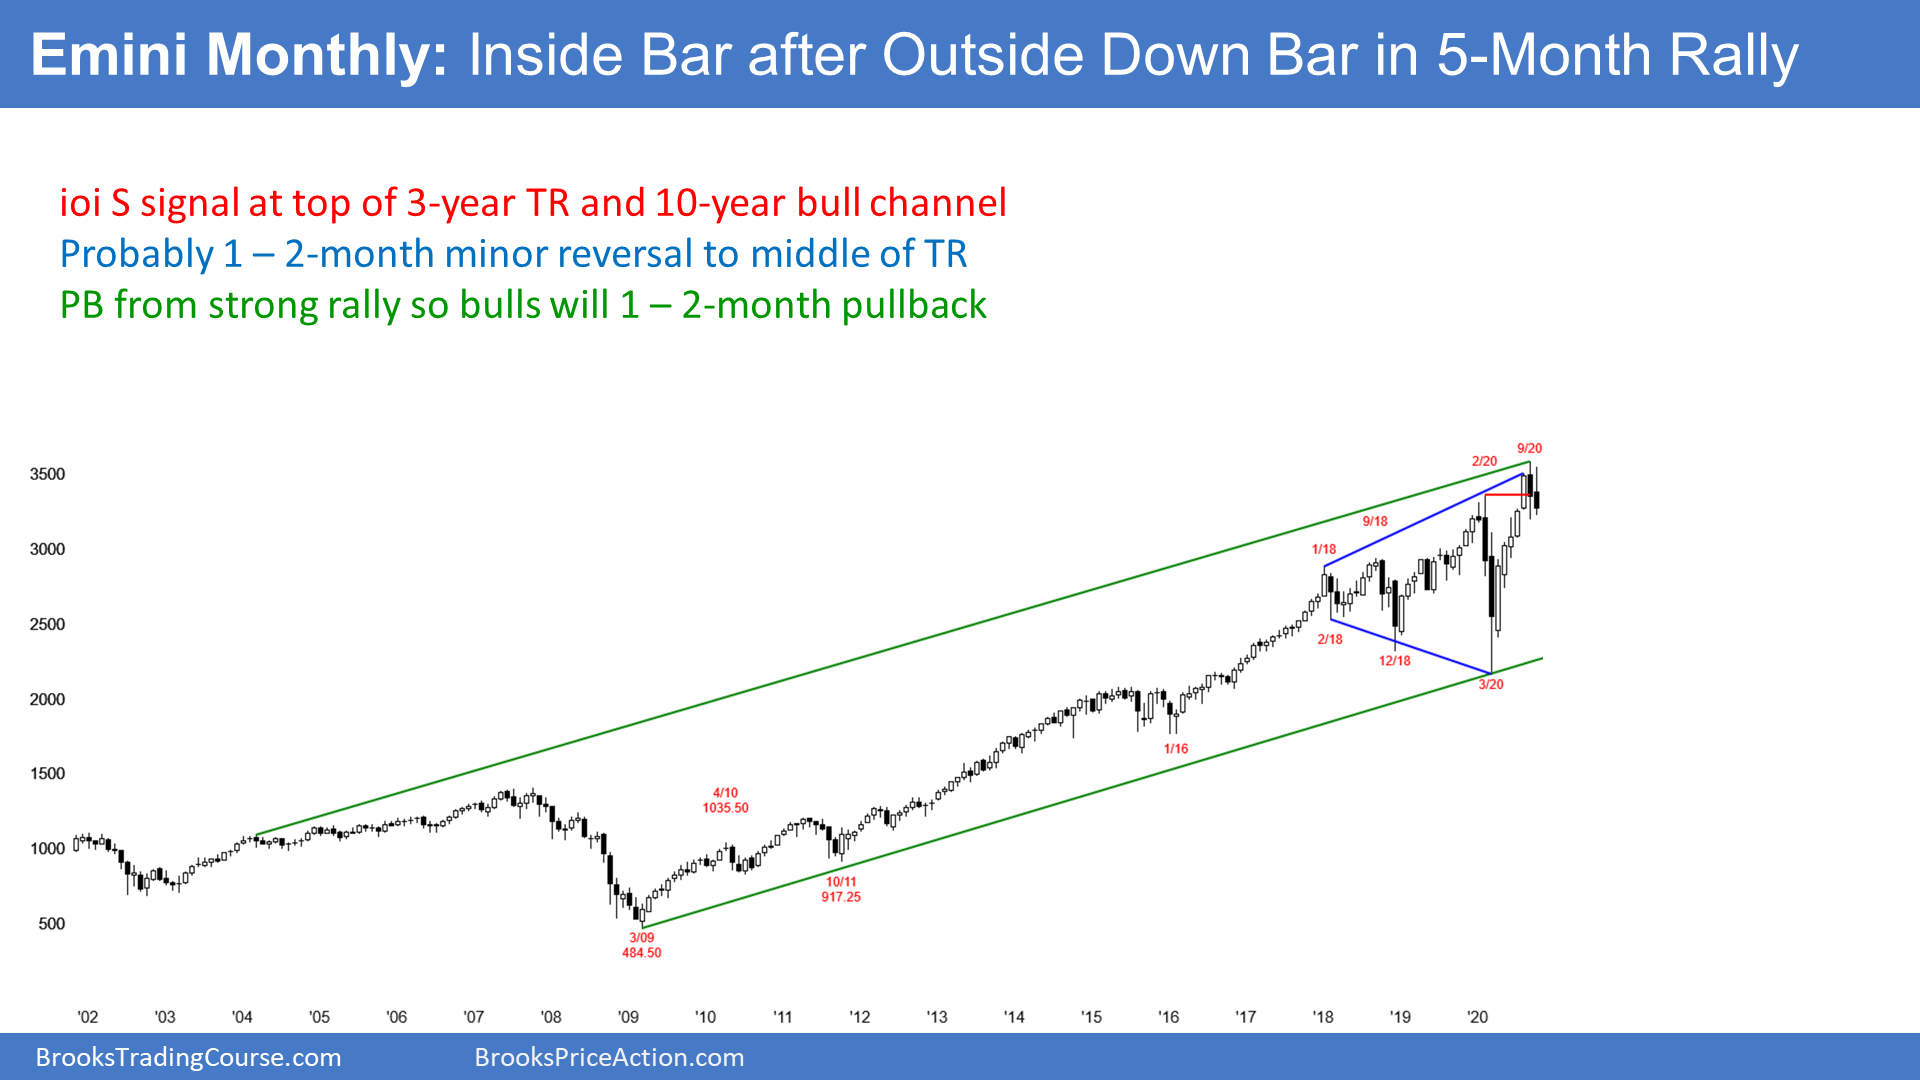
The monthly S&P500 Emini futures chart formed an inside bar in October. At the end of September, I said that this was a good possibility. It followed an outside bar in September. There is now an ioi (inside-outside-inside) pattern on the monthly chart. This is a Breakout Mode pattern.
Generally, a Breakout Mode pattern has about the same chance of a bull or bear breakout. Here, the momentum up since March has been strong. That normally would favor a bull breakout. The bulls see October as a pullback in a strong bull trend. It is therefore a High 1 bull flag buy signal bar.
But this ioi has consecutive bear bars. That increases the chance of a break below the October low, which would trigger the monthly sell signal.
Also, this is the 2nd reversal down in 3 months. October is therefore a Low 2 Top sell signal. A 2nd signal has a higher probability of leading to a reversal down.
Finally, there is a 3-year Expanding Triangle top, and the Emini is at the top of a 10-year bull channel. This is a resistance area, and the 5-month rally was extreme and therefore climactic. These factors make a reversal down below the October low more likely than November breaking above the October high.
But a buy climax is also a sign of strong bulls. Traders should expect the bulls to return after a 1 to 2-month pullback. That pullback might reach the middle of the 3-year trading range, which is around 2900.
Weekly S&P500 Emini futures chart is turning down from a double top
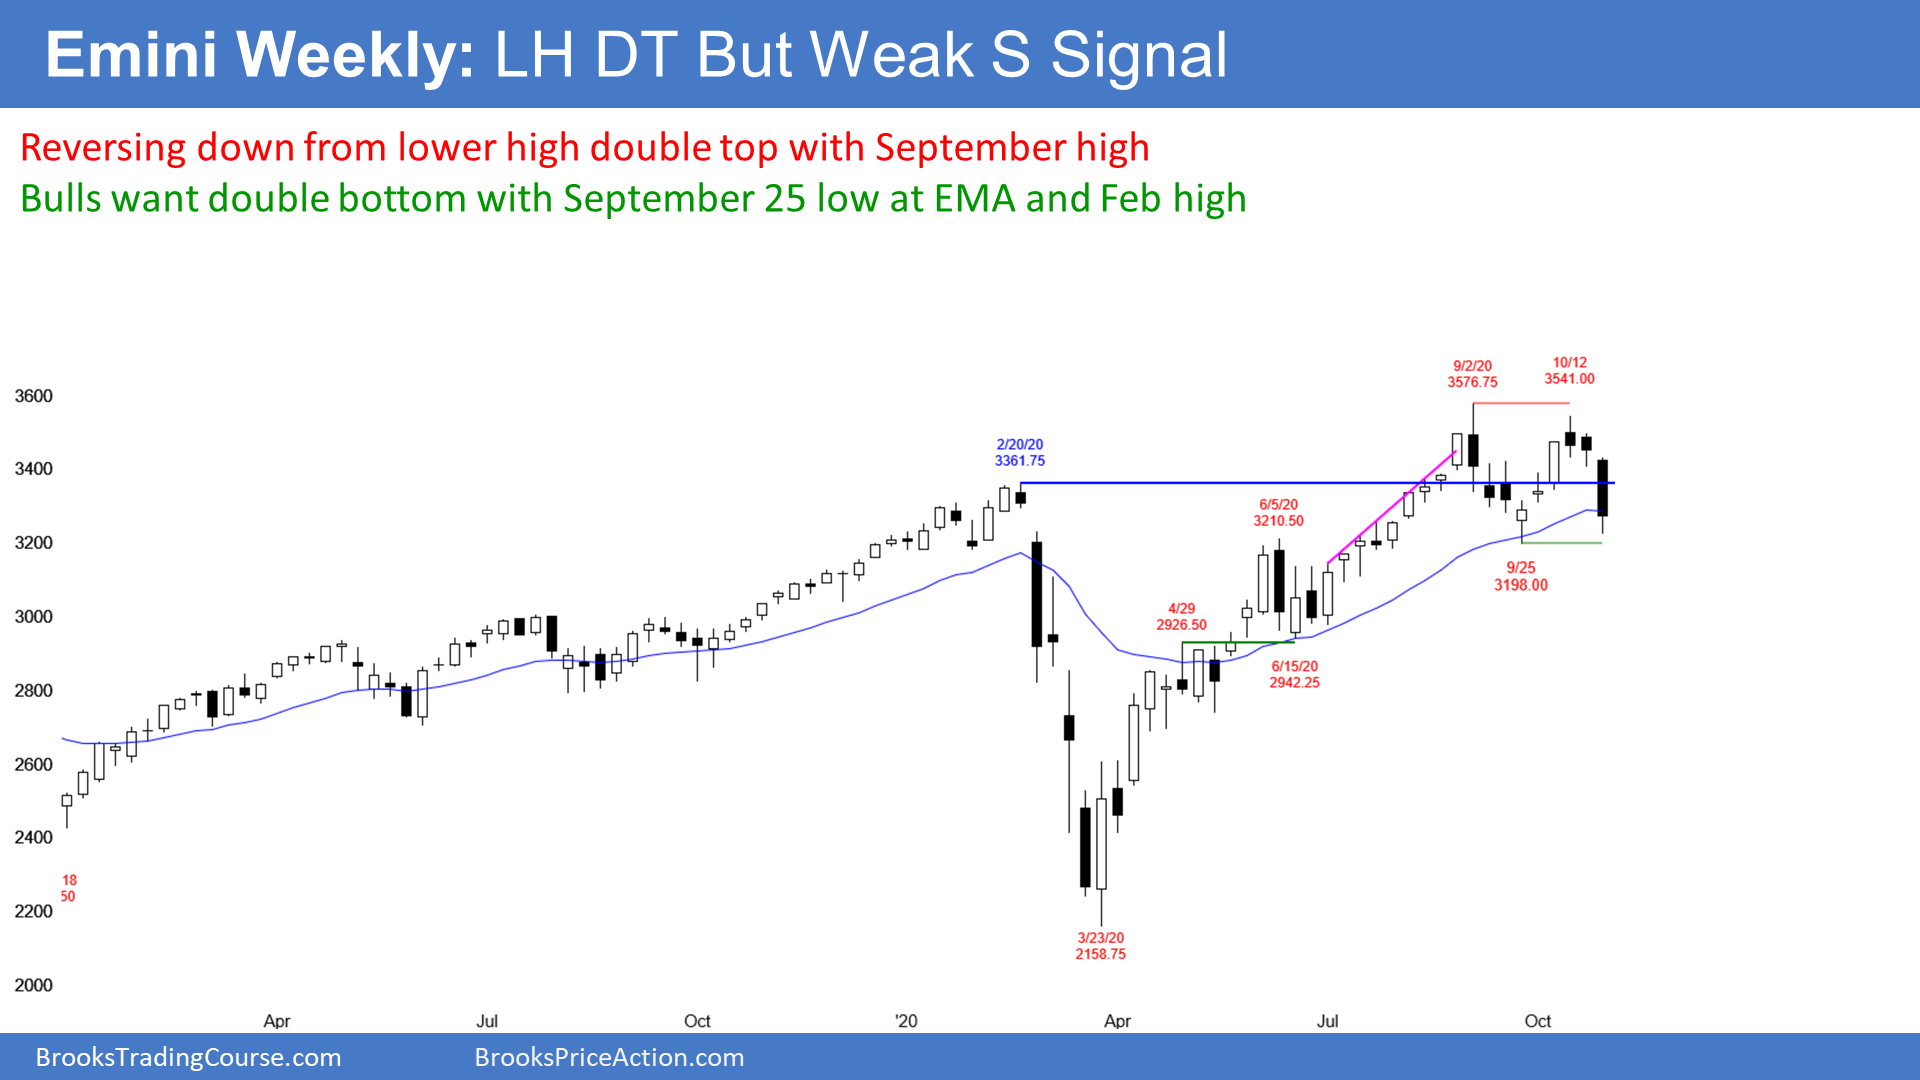
The weekly S&P500 Emini futures chart has sold off for 3 weeks from a double top with the September all-time high. Traders are wondering if the selloff will break below the September 24 neckline of the double top. Alternatively, the bulls expect a reversal up from a double bottom with that low.
Everyone knows that there will eventually be a breakout, but in which direction? Trading ranges resist breaking out. The legs up and down are often strong, as these have been, yet reversals are more likely than breakouts.
Breakouts need consecutive closes
If the bears get a couple consecutive closes below the September 24 neckline of the double top, they will look for a measured move down. That would be below 2900, and it would also be around a 50% retracement of this year’s rally.
The bulls want a breakout above the 3-month trading range. They will then look for a 400-point measured move up to 4,000. If they get consecutive closes above the September all-time high, traders will expect higher prices.
Which is more likely, up or down? It really is close to a 50-50 bet. However, the Expanding Triangle top and the resistance of the top of the 10 year bull channel make a bear breakout more likely.
Would I be surprised by a bull breakout? How could I be? The bulls have at least a 40% chance of a test of the top of the range and a breakout. If they succeed, no one should be surprised.
Daily S&P500 Emini futures chart has parabolic wedge sell climax and possible double bottom
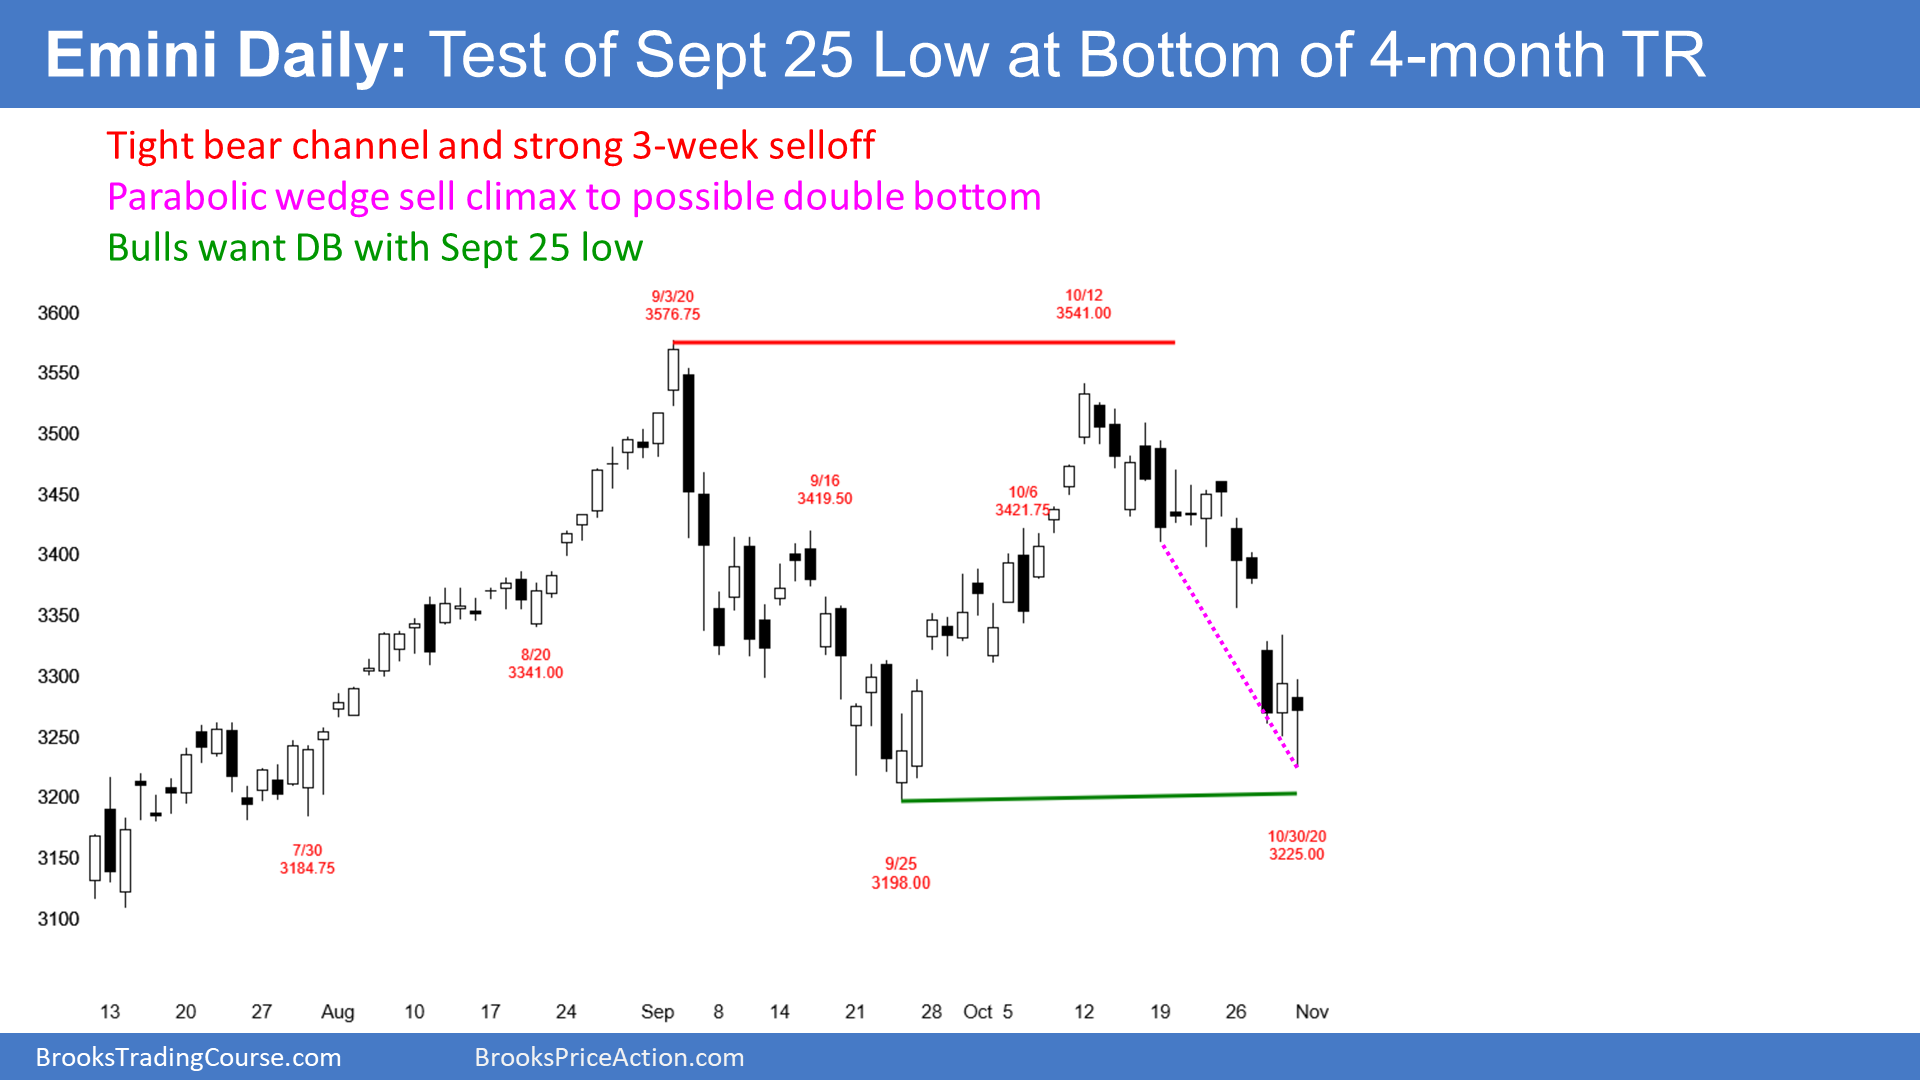
The daily S&P500 Emini futures chart has sold off strongly for 3 weeks. The bears want a strong breakout below the September 25 low. That is the neckline of the double top. They then want a 400-point measured move down to the middle of the 3-year trading range.
A major trend reversal like this has a 40% chance of leading to about a measured move down. But, there is currently a 60% chance that the Emini will fall at least a little below the September 25 low.
One tick below that low is also the theoretical stop for the bulls who see the 3-week selloff as just a deep pullback from the early October rally. In general, when an obvious stop gets hit, there is a 50% chance that the breakout will continue down and a 50% chance that it will soon reverse up.
The bear trend is more likely to continue if there are consecutive bear bars closing below the breakout point, and if the bars are big and they close near their lows. The less a breakout looks like that, the more likely it will fail. For example, if there is a big bull bar closing on its high just after the breakout, traders will assume that the breakout is failing.
There is always a bull case
What happens if there is no bear breakout? The bulls see the 3-week selloff as a parabolic wedge test of the bottom of a 3-month trading range. They expect a higher low double bottom with the September 25 low.
Because Friday closed above its midpoint, it was a reversal day. The bulls see it as a buy signal bar. At a minimum, they want a reversal back up to the middle of the 3-month trading range. Since it is coming at the bottom of a 3-month trading range and the Emini is oversold, the Emini should bounce early next week.
The bulls currently have a 40% chance of a reversal up from above the September low to the top of the 3-month range. Why not higher probability? Because the 3-week bear channel is tight. Also, that ioi sell setup on the monthly chart will probably lead to November falling below the October low. Since that low is just above the September low, the Emini will probably test below the September low as well.
Possible island bottom
This Emini gapped down this week. That created a month-long island top with the September 28 gap up. But island tops and bottoms are usually minor reversals. There are always other technical factors that are more important.
If there is a gap up on any day next week, there would be an island bottom with this week’s gap down. However, there is resistance above at the 50-day MA and the middle of the 3-month trading range. Also, the momentum down has been strong for 3 weeks. Finally, there is an ioi sell signal on the monthly chart. All of these are more important. Therefore, an island bottom might lead to a bounce for a week or so, but traders will still expect the Emini to fall below the November low.
What about the US election?
The stock market does not care who is president. It only cares about the Fed. Some presidents claim to have magical superpowers and control over everything, but that is nonsense. The stock market went up more under Clinton and Obama than under Bush and Trump. Our system is much bigger that one person. The president is such a tiny part of the calculus that he is not worth considering when debating whether the market will go up or down.
Confusion and lawsuits after the election could cause a sharp selloff, but it won’t last. The bulls will buy a 1 to 2-month selloff and the bears will sell a 1 to 2-month rally, no matter who is in the White House. Why? Because the market has been in a trading range for 3 years and traders will fade (bet against) moves up and down.
