The S&P 500 E-mini futures has rallied strongly in November, but most of the bars on the daily chart have been weak. This makes the rally more likely to be a bull leg in a trading range that started in September, and the start of a measured move up. E-mini futures down probably on next 10% move.
Gold Futures are turning down on the weekly chart. This is probably the start of a trading range that will last many months.
Bitcoin is pulling back from a parabolic wedge buy climax on the daily chart. Traders should expect at least a few weeks of sideways trading.
Gold futures
Gold futures weekly chart turning down from wedge buy climax just below 2011 all-time high
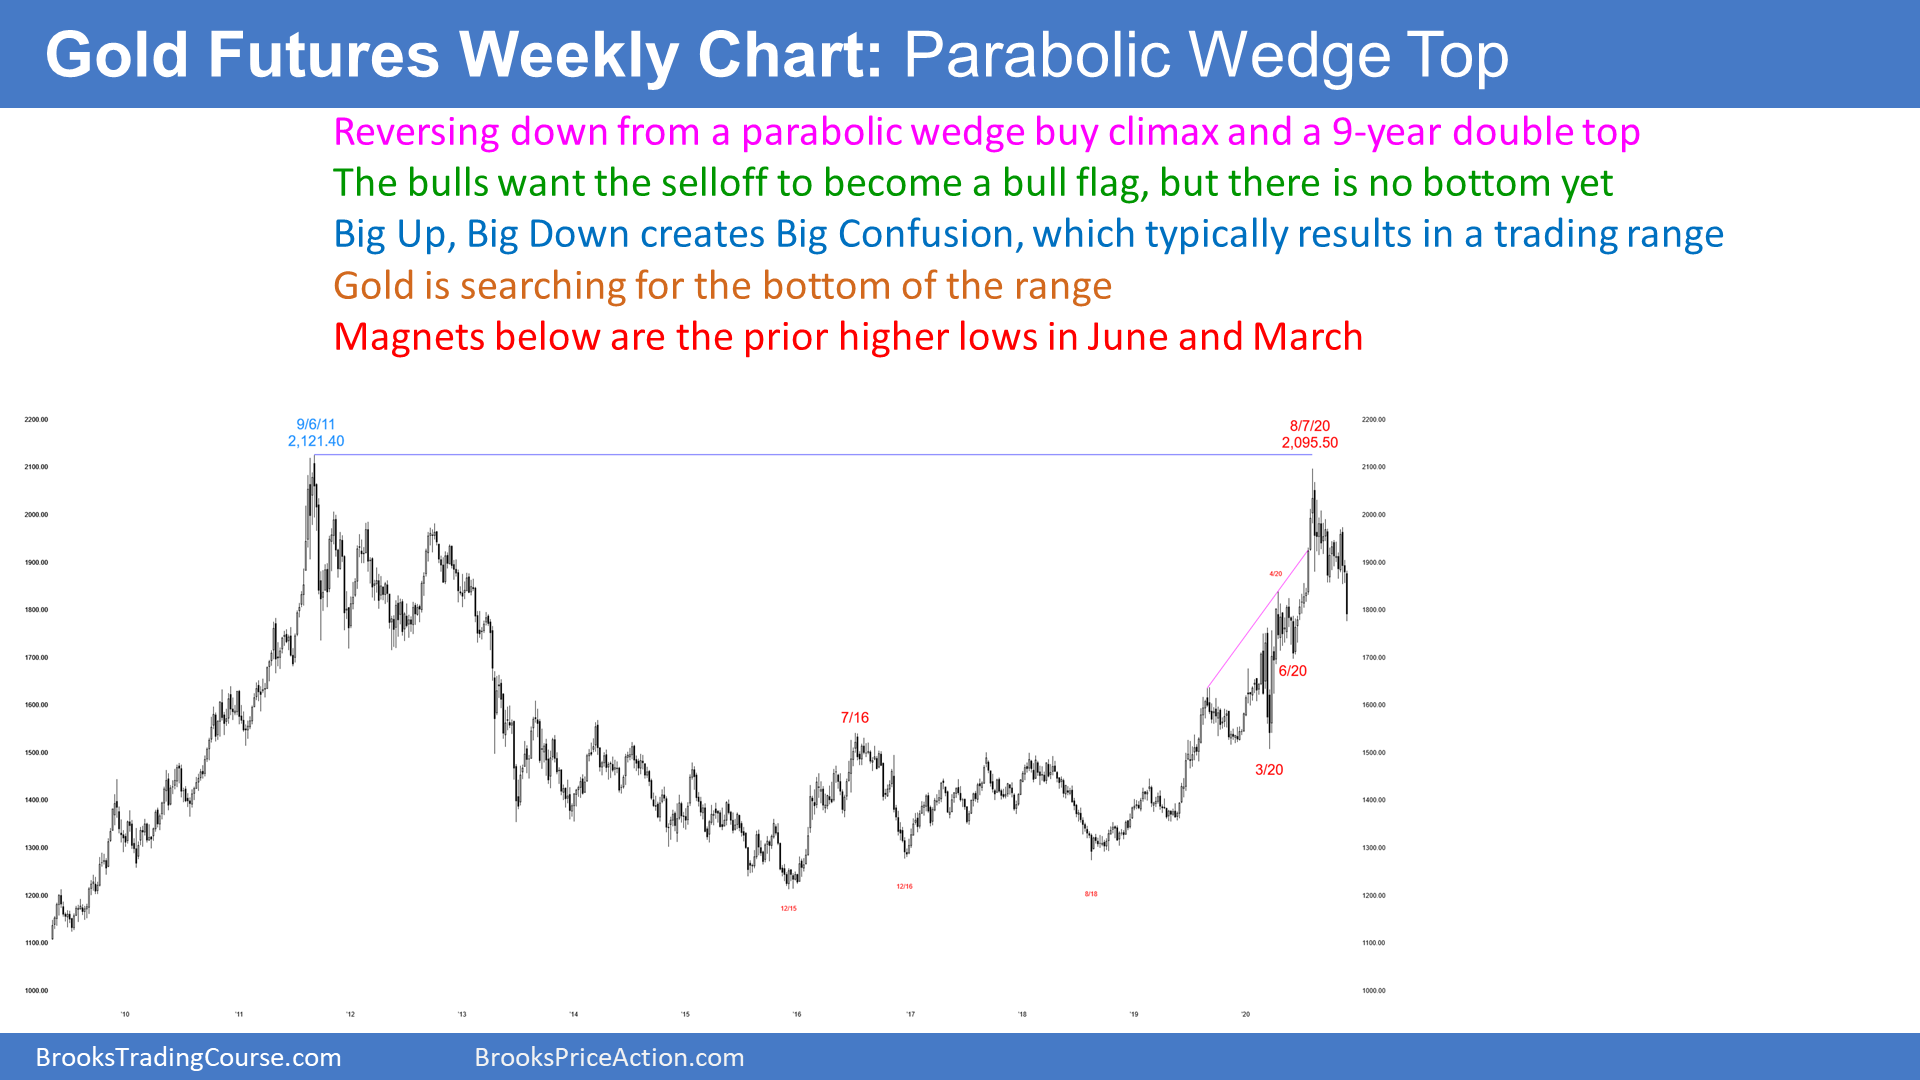
The weekly gold futures chart has sold off since the August high. The reasons I am showing it is to remind traders that TV experts are often incorrect, and to explain some things that are going on in the E-mini and bond futures markets.
If you watched any financial show this summer, you repeatedly heard how gold was early in a bull trend and that it was going far above the 2011 all-time high. The soundbite was “interest rates to zero and gold to infinity!” All of the experts were linking the two.
Where have the experts gone now that gold is down almost 15% from the high? No one is talking about gold now, because they don’t want to remind everyone about how bullish they were in August when gold was testing the top of a buy climax and testing the 2011 all-time high.
What next?
The bears are hoping that the gold market is forming a double top with the 2011 high. They want a bear trend reversal. The rally since the August 2019 high has had 3 legs up. The bears hope that this is a wedge rally to a double top with the 2011 high. They know that this is a reliable reversal pattern.
A reversal down from a buy climax typically has at least a couple legs sideways to down. The current selloff is now in its 3rd leg down. But since the 3-month selloff is in a tight bear channel, it is probably a complex 1st leg down. If so, traders will expect the 1st rally to fail. They then would look for a 2nd leg down.
At that point, if there is a reliable setup, they might buy for a resumption back up to the 2011 high. More likely, the weekly chart will enter a trading range. This process will take 20 or more bars, which means 6 months or more.
This selloff is now in search of an initial bottom. A reasonable target would be around the June low, which is a little more than a 50% retracement of the rally that began in March.
A wedge reversal often retraces to the start of the wedge bull channel. That is the March low. That is also at the July 2016 high, which is the top of the 2013 to 2019 trading range.
The news is always extremely bullish just before a reversal down
It is important to understand that when a market is in a buy climax, the news is always extremely bullish. It has to be, otherwise the market would not be racing up.
But the mistake is to assume that the news is right. The experts on TV are constantly giving all of the reasons why the trend is early, and it will go much higher. They are very confident, and they arrogantly look down at the fools who are not already long. They wear nice suits and have impressive titles, but they are idiots.
The church of gold
This is especially true in the gold market, which is more of a religion than a commodity. When it is up, they say you must buy because it is going higher. When it is down, they tell you that you must buy because it will soon race back up to the high.
Ask them what would make them sell. They will tell you that there is never a reason to sell, and there is always a reason to buy.
Do you think that is useful advice? If you bought gold for $2,100 in 2011 and watched it lose 40% of its value in 6 years, do you think that was the best choice for your money? Gold is not always the best choice. In fact, it rarely is the best choice. Most of the time, some other market will make more money for you.
Buy climaxes lead to profit-taking
Now, why does a market reverse down from a strong bull trend? You cannot have a buy climax unless everyone is bullish. FOMO… Fear Of Missing Out. Smart traders buy early and look for an extreme buy climax to take profits. They buy low and sell high. Also, smart bears start to short when there is an extreme rally, and they sell more higher.
The last buyers are the momentum traders. And don’t forget the dumb money traders who missed the move. They believe all of the hype and are desperate to buy at any price.
The momentum traders are buying because the market is going up. Once it stops going up, they quickly exit. Their panic selling once they sense that the bulls are starting to take profits accelerates the reversal down.
They are not investors, who are willing to use wide stops or no stop at all. Investors will buy more during a collapse because they are in it for the long haul. They are confident that gold will be higher 10 or 20 years from now, and will use selloffs to buy until they have the desired amount in their portfolio.
Golden lambs to the slaughter house
The dumb money traders, who follow the gold gurus on TV, buy at the top and hold until after the crash. They then exit with a big loss. They do not understand the risk of buying during a buy climax.
Very importantly, they do not have a plan to exit. They do not think about whether they are momentum buyers or investors. Remember, a momentum buyer exits quickly when the rally slows down. Investors buy more after a big selloff.
Dumb money does not have a plan. They expect the gold tree to grow to the sky, like the guy on TV says. When gold sells off, they are faced with a reality that is very different. They suddenly decide that they are not willing to sit through a 6-year bear trend that erases 40% if their money. And the TV guy is nowhere to be found to help them manage their bad trade.
Interest rates bottoming after 30-year bear trend
Because of that linkage between interest rates and gold, I want to summarize that I have been saying about the bond market since the March buy climax. I have talked about the bond market for years, saying that it is near the end of a 30-year bull trend and that it will fall for at least a decade. Remember, the bond market moves opposite to interest rates. As bonds fall, interest rates rise.
I said that interest rates could not hit zero in the U.S., and that they will work higher over the next decade. The bond futures market could briefly go above the March high, but at this point, it is more likely that it will not. If they rally over the next several months, the rally should fail around or below the old high. They could stay sideways for several more years, but they will be higher 5 years from now, and higher still 5 years after that.
So much for “interest rates to zero and gold to infinity.”
Bitcoin market
Bitcoin daily chart is turning down from parabolic wedge buy climax and test of all-time high
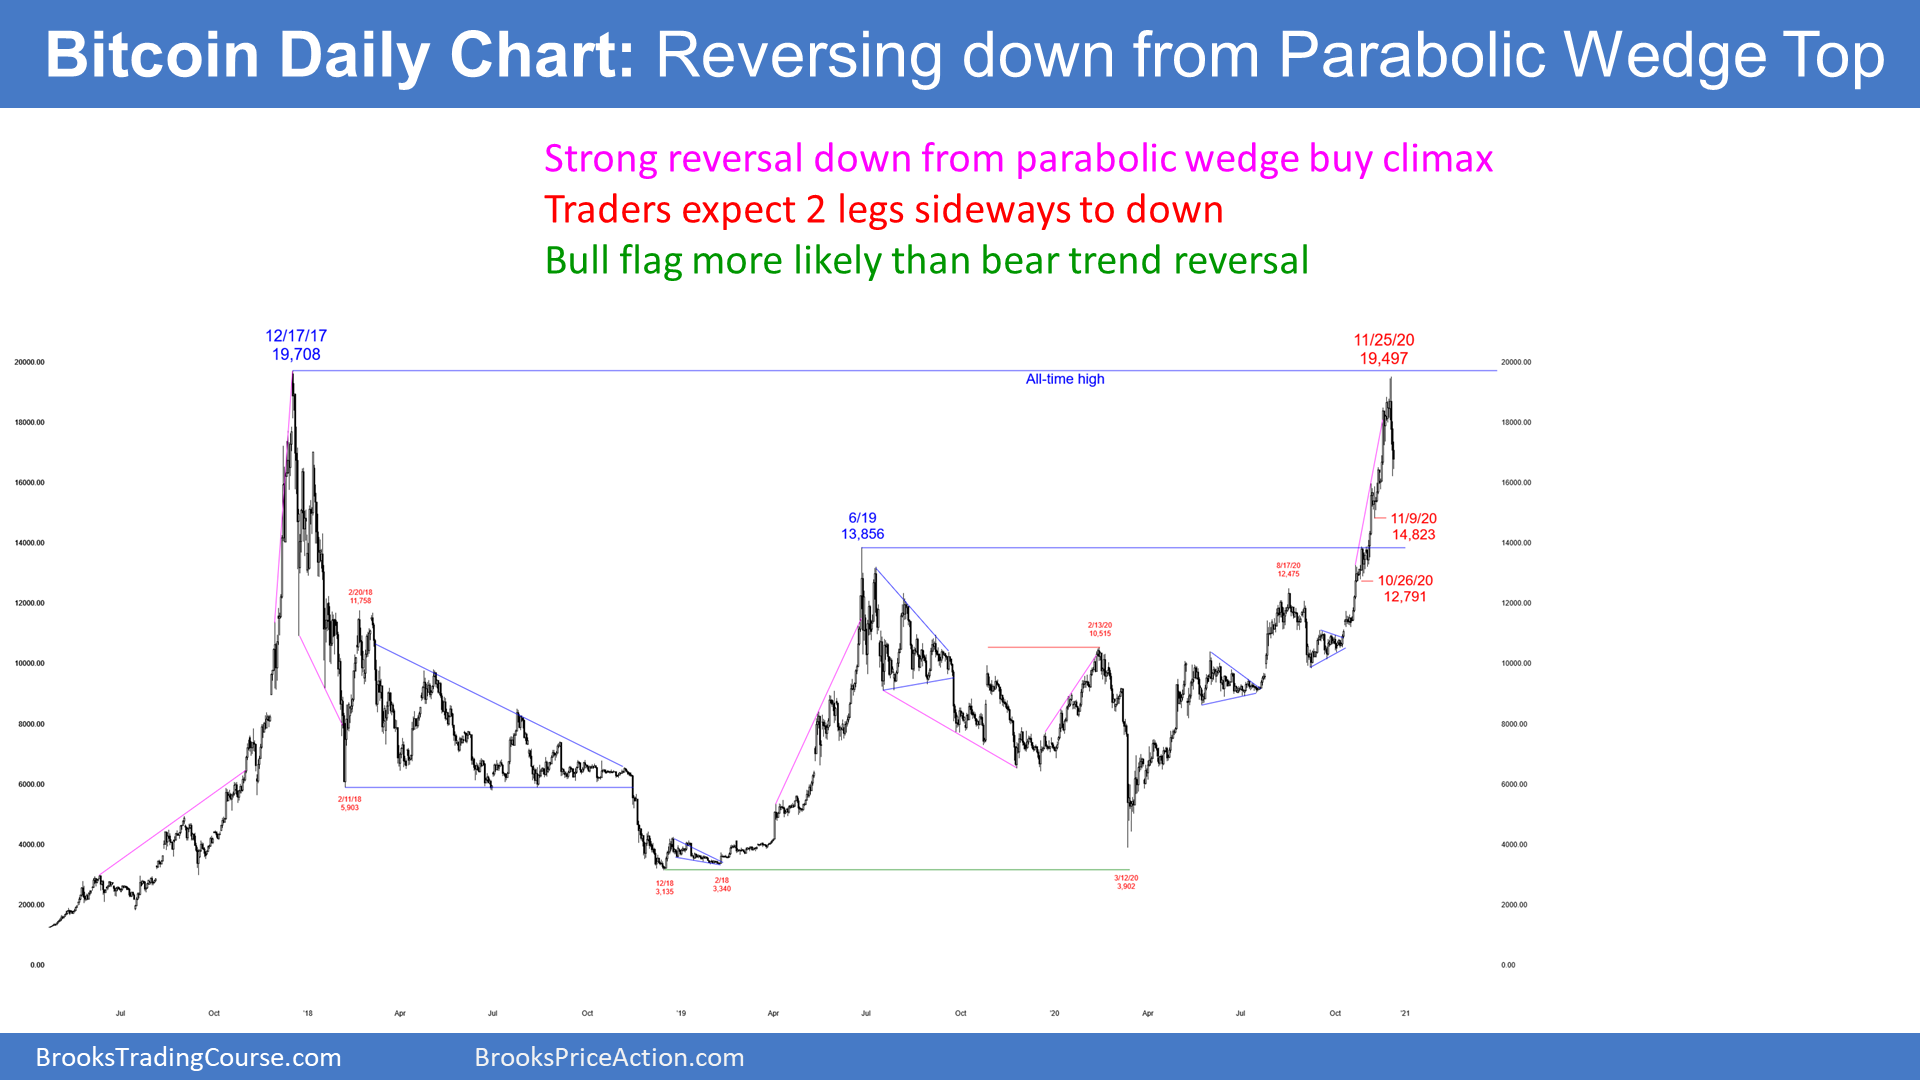
The Bitcoin cash index daily chart has rallied 5-fold since the March low. Pundits portray bitcoin as a replacement for gold as a storehouse of value. The news often describes it as “digital gold,” implying that people are selling gold and using the money to buy bitcoin. While this is true to some extent, it is impossible to know how significant it is. I suspect not very.
The 3-month selloff in gold happened as bitcoin went up 500%. Is this as cause and effect? No, because there are many reasons to own gold that are unrelated to bitcoin, and many reasons to own bitcoin that have nothing to do with gold. However, they have had a strong inverse correlation over the past several months, and the TV financial news often says that some of the money going into bitcoin is coming out of gold.
Bitcoin has reliable chart patterns
What next? When you look at the daily chart of bitcoin over the past 2 years, you can see that there are many traditional chart patterns. You should expect that with all markets that have lots of participants.
This is because a chart is simply a map of rational human behavior. That behavior is coded in our genes. Until we evolve into another species, the behavior will remain the same. It does not matter if you are trading stocks, baseball cards, or bitcoin. If you remove the labels, the charts would look the same.
Parabolic wedge buy climax
As strong as the 5-week rally has been, there are 3 legs up in a tight bull channel. The rally is therefore a parabolic wedge buy climax.
Buy climaxes typically attract profit-takers. If a bull takes profits, he is not going to buy again 1 bar later. He is concerned that the profit-taking could be strong enough to lead to a deep selloff or even a bear trend.
The bulls still want to buy, but they like to wait until after they see the bears try and fail at least twice, to create a trend reversal down. Therefore, a buy climax usually leads to at least a couple legs sideways to down.
If the bears fail to create a trend reversal down, then the bulls will buy again. They expect the bears to fail and give up, and for other bulls to buy again as well. They are looking for a resumption of the bull trend.
But if the bears create an endless pullback down, traders will conclude that the pullback has evolved into a bear trend. There is no sign of that at the moment.
More often, a big move up and the reversal down is a Big Up, Big Down pattern. That generates Big Confusion, and confusion is a hallmark of a trading range. This selloff is likely the start of a trading range that should last at least a month. The bulls will see the range as a bull flag. The bears will look for some kind of double top, in addition to the 2017/November 2020 double top. Therefore, traders expect bitcoin to go sideways for at least the next month.
S&P500 E-mini futures
Monthly E-mini chart has huge bull bar in November, but October was a bear bar and therefore weak buy signal bar
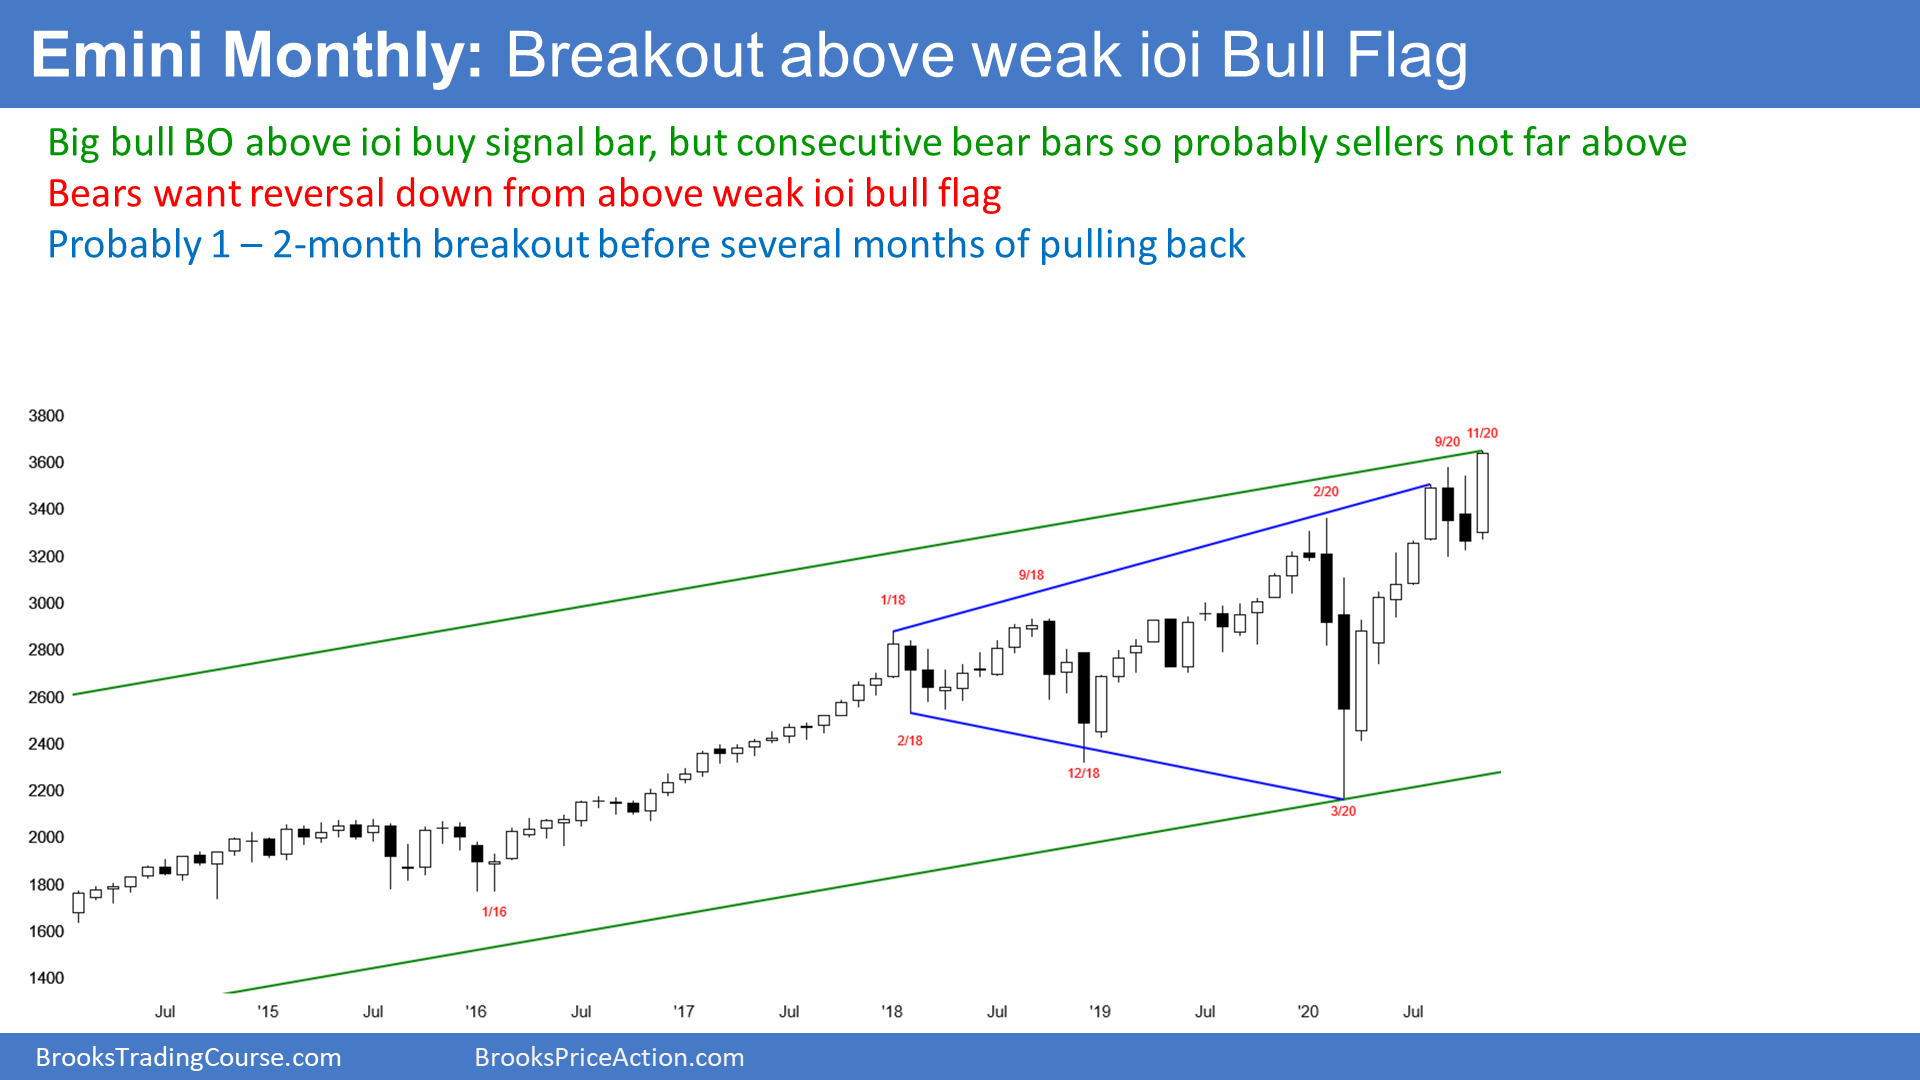
The monthly S&P500 E-mini futures chart has a big bull bar so far in November. There is one trading day left in the month. The bulls want November to close above the September high at a new all-time monthly high. That would increase the chance of higher prices in December. However, the bears want November to close back below the October high. That would reduce the chance of a strong December.
October was a High 1 bull flag buy signal bar. When the E-mini rallied above the October high, it triggered the monthly buy signal. The bulls want a resumption of the 5-month bull trend.
But the October buy signal bar was a bear candlestick. That is an unreliable buy signal bar. With it being the 2nd consecutive bear bar, it is even more unreliable. There will more likely be more sellers than buyers above the October high, even though there is no sign of them yet. The rally could last a couple months, but traders should expect a reversal down within a month or two.
The reversal down in September led to a 2-month pause in the bull trend. Since November is a big bull bar after a 5-month buy climax, it probably will be an exhaustive buy climax. If so, traders will expect at least a couple legs sideways to down once this climactic breakout ends. It should end in December. Consequently, traders should expect the E-mini to be mostly sideways for the 1st half of 2021. That would increase the number of bars in the trading range than began in August.
Possible gap up on Monthly chart on Tuesday
Monday is the final day of November. The E-mini has been in a strong bull trend since the March low. If Tuesday gaps up to a new all-time high, there will be a rare gap up to a new all-time high on the monthly chart.
While the gap could be big on the daily chart, it will probably be small on the monthly chart. Small gaps typically close before the bar closes. If it stayed open through December, it would likely close in January or February.
Everyone on TV is bullish
What about the uniformly bullish experts on TV? If you’ve been trading for a few years, you might have noticed a pattern. There is an annual ritual. In November and December, the financial networks trot out an endless series of experts predicting that the next year will be up 10 to 20%. You don’t get on TV unless you are eager to say bullish things about the coming year. If they did not put you on last year, you have to make an even more outrageously bullish prediction this year to make sure you will be on TV.
Since most years are up, it is a safe thing to predict an up year. However, not all years are up. I will show the yearly chart at the end of the year. It is currently a big outside up bar. But that is not bullish when it comes late in a bull trend. The current bull trend is now 10 years old. The rally is now late.
More often, a big bar late in a bull trend attracts profit-takers. Therefore, both the monthly and yearly charts look like they are predicting a lack of a rally for the next 6 – 12 months.
Could the charts or my reading of the charts be wrong and the TV experts right? Absolutely. But the monthly and yearly charts look like they will lead to a sideways market for many months.
Weekly S&P500 E-mini futures chart weak breakout above High 1 bull flag buy signal bar
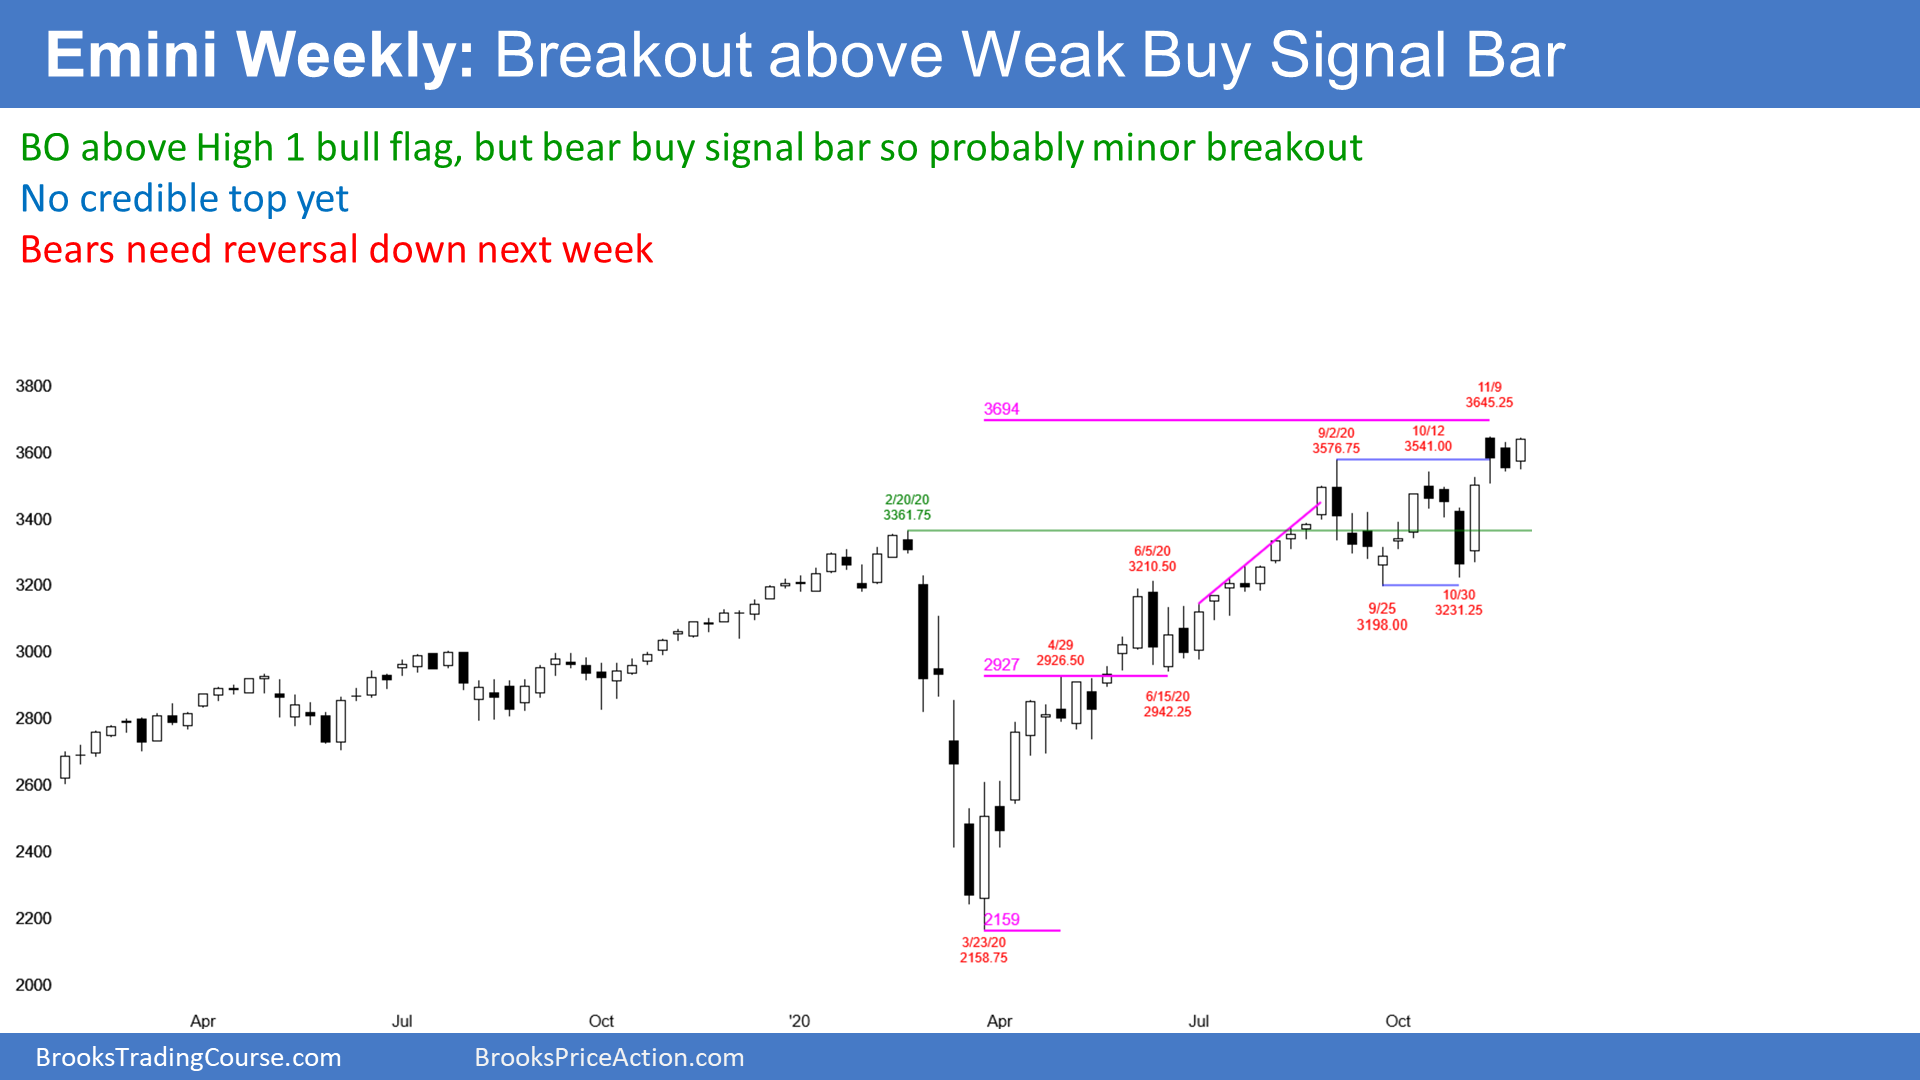
The weekly S&P500 E-mini futures chart has a pattern that is similar to the one on the monthly chart. There is a High 1 buy signal bar, and it was the 2nd consecutive bear bar.
Traders typically expect more sellers than buyers above a weak High 1 bull flag buy signal bar. The market can sometimes rally for a couple bars (weeks), but it then usually reverses down a 2nd time. The 2nd reversal is usually more complex and lasts longer. While the pullback in September led to 2 sideways bars, if there is a pullback within the next few weeks, traders will expect at least a couple small legs sideways to down. They will look for a trading range lasting at least a month.
Can the E-mini explode to the upside and begin a strong rally to the end of the year? The bulls have a 30% chance. However, with this week closing on the high and strong momentum up 3 weeks ago, next week should go above this week’s high.
Daily S&P500 E-mini futures chart in strong rally, but next 10% move will probably be down
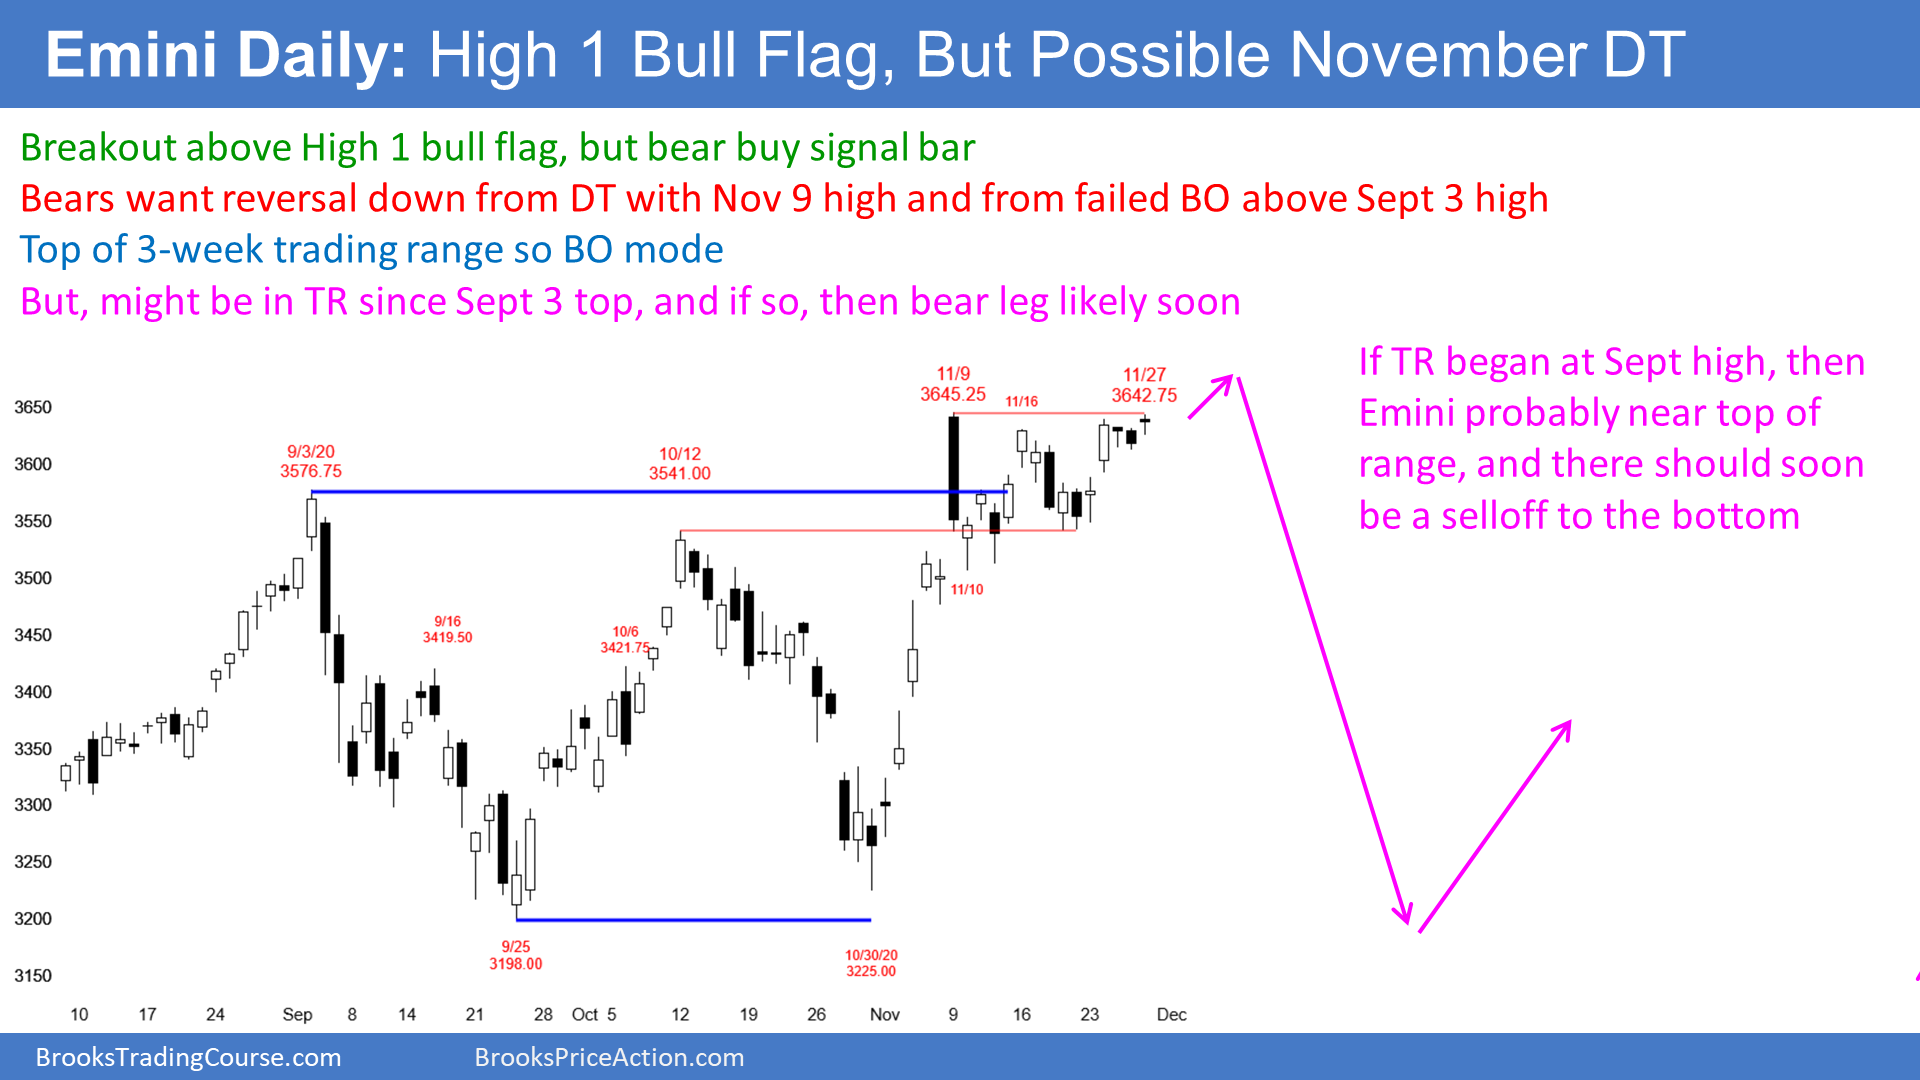
The daily S&P500 E-mini futures chart had a quick move up to the November 9 high, but then went sideways. I have talked about the bars in that rally and in November a few times. In November, about 75% of the bars closed either around their open or in the middle of the bar. Those are weak bars. Yet, the month is forming a huge bull bar on the monthly chart. Something is wrong here.
Bull trends usually have lots of bull bars closing near their highs. Look back at the summer rally as an example. If the November rally is not consistent with a bull trend, it might be a big bull leg in a trading range. As a general rule, if something does not look the way you think it should, the chart is probably forming a trading range.
If I’m right and this rally to a new all-time high is simply a strong bull leg in a trading range that began after the September 3 top, where is the top of the range? It is probably not much higher. As I wrote above, December could be another bull bar on the monthly chart, but traders should expect a trading range on the monthly chart by early next year.
The next 10% move in the E-mini will probably be down, not up
The bottom of the range will probably be around the September low. That is about 12% down from the current November high. Let’s say about 10% down. Since I think the November rally is part of a trading range, and not part of a successful breakout of the 400-point tall, 4-month trading range, then I am saying that the next 10% move in the E-mini will probably be down and not up. We just don’t know when the move down will begin. I believe it will start in December or early January, and that it will come before the E-mini rallies 10%.
Also, if the E-mini gets down to near the September low, it will probably fall below. This is because traders would conclude that the E-mini had entered a trading range, and legs in trading ranges tend to break beyond support and resistance before reversing. Therefore, if there is a selloff, it will probably be more like 15 to 20% instead of just 10%.
What would cause the selloff? It will be technical. The daily chart looks like it is in a trading range. It is now at the top and therefore it should go back to the bottom.
News reporters are narcissists and incorrectly assume everything is caused by the news
There is news every day. Whatever the news is on the day the selloff begins will be what TV reporters will definitively claim as the reason for the selloff. That is because they believe that they are the center of the world. To them, everything is related to the news, which means to them. They cannot imagine that something else unrelated to the news, like technical factors, might be the real cause.
The news could be the catalyst, but the price action is already telling us that a selloff is likely. There are bad bull flags on the weekly and monthly charts and too many bars on the daily chart with weak closes.
Also, remember what I wrote last week. There is an increased chance of a surprise after January 5. What is the surprise? Who, knows? That’s what makes it a surprise!
What about next week?
The momentum up in the rally from 3 weeks ago was strong enough to make a new high likely this week. As I mentioned above, November has been a very strong bar on the monthly chart. Traders should not be surprised by a gap up to a new all-time high on Tuesday when December begins. That could lead to an acceleration up for several days and even a couple weeks.
But it would probably be an exhaustive buy climax and the end of the rally from the March low. There is currently only a 30% chance that the breakout above the September high will lead to a 400-point measured move up.
