Andrew Lo says, in a new paper refining a hypothesis he first presented eight years ago, that the hedge fund industry is the “Galapagos islands” of the financial globe. It is the place where the underlying evolutionary dynamic becomes most obvious.
Lo has been pressing and expanding his “Adaptive Markets Hypothesis” at least since 2004, when he wrote a paper with that phrase in its title for the Journal of Portfolio Management. The gist of it was that although the ECMH postulates individuals who “maximize expected utility and have rational expectations,” an adaptive hypothesis postulates “organisms that have been honed, through generations of natural selection, to maximize the survival of their genetic material.”
In the context of finance, this means that individuals will make decisions according to sometimes rough rules of thumb, “heuristics,” to survive the challenges with which they are familiar, and that “as long as those challenges remain stable, the heuristics will eventually adapt to yield approximately optimal solutions to them.”
Refinements
In his new paper, Lo continues to refine his theory, and he generally presents it as a development, even one might say an evolutionary adaptation, of the ECMH rather than an overthrow and replacement thereof.
He also has developed AMH in order to educe from it five important implications:
- During times of crisis, the usual positive relationship between risk and return may not hold;
- A market’s degree of efficiency is itself a variable that can be measured and managed;
- Diversification has become more difficult to achieve over time, though it remains a “worthy objective”;
- Natural selection among asset managers and investors can turn alpha into beta or into zero; and
- A static approach to asset allocation (such as, say, 60 percent equities and 40 percent bonds) won’t produce optimal results.
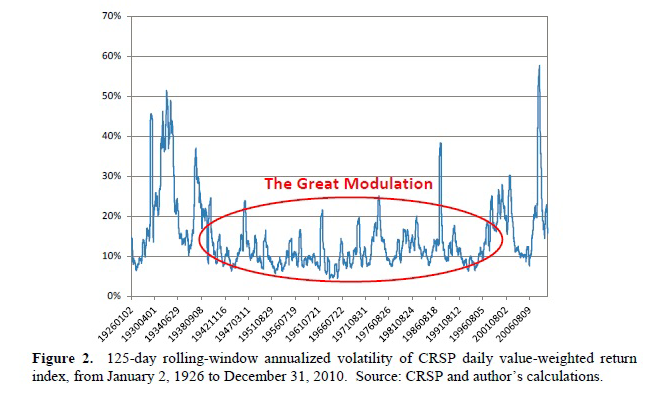
In the course of making his case for these propositions, he produces a striking graph that shows the “Great Modulation,” the period from about 1938 until 2008. Now that we have five year’s distance from its end and can see it as a historic period, we can also see that U.S. equities were remarkably low-volatility instruments throughout those seven decades.
That graph is based on data from the University of Chicago’s Center for Research in Security Prices, supplemented by Lo’s own calculations. It shows the movement of a 125-day rolling window of annualized volatility, on a time line that begins on January 2, 1926.
There is an early spike of volatility above 40 percent, reflecting the 1929 crash. Then there is a more protracted high-vol mesa, that briefly got as high as 50 percent, in the early depression years, and a lesser peak, getting to 35 percent, in the later depression years. But that is it: for a long time. Volatility zigzags around, below 30 percent, from 1938 until the new millennium. This generalization has a single brief exception, a 1987 spike, produced by an anomalous crash that October.
Lo says that during this long period the assumptions of the EMH and the “traditional investment paradigm” were not far wrong. They represented “reasonable approximations to U.S. financial markets.” But the most recent peak was not, he thinks, a temporary aberration. It was an end to that era. Given, for example, the new financial technologies that connect capital markets around the world to an unprecedented degree and propagate local financial shocks, even if we do enjoy a future period of analogous “modulation” we will do it in the awareness that periods of market dislocation are always going to be possible, and we need a way of understanding financial phenomena that accounts for these periods. Indeed, that anomalous-looking 1987 crash and volatility spike, enhanced as it was by LOR’s portfolio insurance, can be seen as a harbinger.
Risk and Return
On the specific subject of the risk-return relationship, Lo makes the point that in a range of contexts, individuals “end up taking more risk than they [intend to], simply because they feel safer than they really are.” One much-researched example is the use of seat belts – or air bags – in automobiles. Drivers may feel that safety improvements reduce risk more than in fact they do, and drive recklessly as a consequence. The finance analog is what comes about if, for example, investors believe that portfolio insurance or AAA bond ratings connote more safety than they do.
In more general terms, it is the flight-to-safety (which Lo associates with the primordial, primate fight-or-flight impulse) which complicates the relationship between risk and return. In a crisis, there may be flight away from equities into safe assets to a degree that increases the return on those safe assets, reversing the traditional negative correlation.
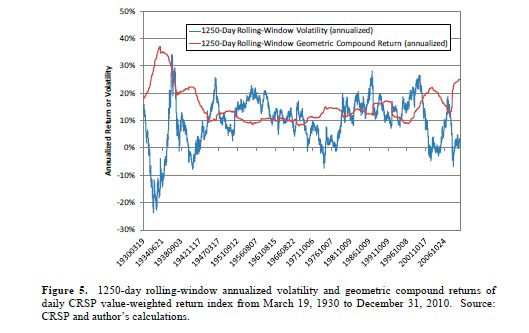
Lo’s paper also includes a graphic display of the rolling window for 1,250 days of geometrically compounded returns and standard deviations of index returns. Note that this rolling window is ten times as wide as the window used for the graph above, so many of the vivid spikes of that chart are smoothed out here.
Again, this is a compound of CRSP data and Lo’s own calculations. The point to note is that there is no consistent relationship between risk (the blue line) and return (the red line). For example, through the whole period from 1947 to 1976, the red line is remarkably flat. At some points therein the blue line is above it, at some times below. At some points the blue line is moving up, at other points down. But throughout that 30-year run, the red line continues straight ahead at 10 percent. There is, in Lo’s words, a “time-varying and often negative relationship between the two,” between risk and return, which illuminates why ECMH ought to be subsumed within his own broader more empirical and biological model.
