The Dow Jones Industrial Average (DIA) gained 54 points on Friday to close at a new record high.
(Courtesy of NASA)
The Dow Jones Industrial Average (DIA) and SP500 (SPY) both notched gains on Friday, with the SP500 (SPY) breaking 1800 for the first time in history and the Dow Jones Industrial Average (DIA) hanging onto the 16,000 level to close at 16,065.
For the week, the Dow Jones Industrial Average (DIA) gained 0.7% while the SP500 (SPY) added 0.4%. The Nasdaq Composite (QQQ) climbed 0.1% for the week. The Russell 2000 (IWM) gained 0.47% on Friday and 0.71% for the week.
Interestingly, the last time the major U.S. indexes climbed for seven weeks straight was in May, 2007, which preceded a double digit decline in the summer of 2007. After that, the major indexes saw one higher high in October, 2007, before heading into the financial crash of 2008.
On My Stock Market Radar
The chart of the SP500 (SPY) tells the story in pictorial form.
Here we can see that the index is near overbought territory at 66 on the RSI chart, and momentum, as represented by MACD, is declining while prices continue to rise. This is a negative divergence and a situation that oftentimes proves to be an indicator of an imminent change in trend.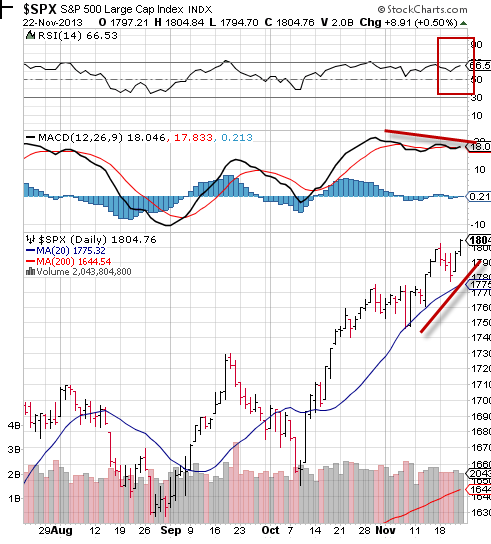
Stock Market News You Can Really Use
As we head for the end of the year, one of the most powerful bull markets in history continues on the strength of support from the Federal Reserve and its historic bond buying program.
The debate over when or if the Fed will begin to taper its program continues to intensify, even among members of the Fed, and the outcome of that debate will likely set the tone for future market action. A December taper has been frequently mentioned in recent days while most investors appear to be pricing in the first move to come in March after Janet Yellen has taken control of the institution.
The Dow Jones Industrial Average (DIA) has set 40 closing highs this year and a strong debate is underway over whether or not this year’s run has created a Fed-induced stock market bubble while the “real” global economy continues to slow.
Many experts say we’re not in a bubble, in spite of this year’s historic run up in stock prices and with the economy only growing at 1.5% year over year. Janet Yellen doesn’t see a bubble while others see valuations definitely on the high side with SP500 (SPY) earnings at 17.6 times operating earnings over the past year, below long term averages but close to levels seen in 1999 prior to the onset of the dotcom crash.
Nobel Prize winner Robert Shiller’s CAPE P/E index is 50% above its median and at the fourth highest level in history, exceeded only by 1929’s Black Tuesday, the period preceding the dotcom crash in 2000, and in 2007 before the onset of The Great Recession and 2008’s meltdown.
Other bubble warnings are net inflows into stock funds and percentages of portfolios in equities.
More than $175 billion has flowed into stock funds this year as fear of being left behind motivates retail investors back into the market, and these sorts of moves typically indicate approaching market tops. Investors now have more than 60% of their investment portfolios in equities, the highest since late 2007, just before the onset of one of the biggest bear markets in history, and margin debt is near all time record highs, another warning sign of potentially frothy conditions.
On the other hand, anti-bubble proponents, including Janet Yellen, say that current and forward P/Es are near long term averages and that there is significant room to run as the global economy improves. Corporate profit margins have benefited from ultra low interest rates which show no sign of climbing anytime soon, however, revenue growth has still lagged in recent months.
So the ultimate question is whether the stock market has been driven to new records by the Federal Reserve or by the outlook for improving corporate profits and earnings? No one knows for sure, but we’re surely going to find out as the coming weeks and months unfold.
Economic reports were mixed last week as the Home Builder’s Index was flat at 54, missing expectations, retail sales climbed and existing home sales declined. Weekly jobless claims declined while PMI increased to 54.3, up from last month’s 51.8, and the November Philadelphia Fed report plunged to 6.5 from last month’s 19.8
The upcoming Holiday shortened week will have several interesting data points, including the closely watched Black Friday retail sales information for clues about the health of the consumer.
Other economic reports include:
Tuesday: October Housing starts and building permits, November consumer confidence.
Wednesday: weekly jobless claims, October durable goods, November Chicago PMI, October leading economic indicators, University of Michigan November consumer sentiment index
Bottom line: The Dow Jones Industrial Average and major U.S. stock indexes continue to power into record territory as debate intensifies over whether the stock market is in a bubble or not.
Disclaimer: The content included herein is for educational and informational purposes only, and readers agree to Wall Street Sector Selector's Disclaimer, Terms of Use, and Privacy Policy before accessing or using this or any other publication by Wall Street Sector Selector or Ridgeline Media Group, LLC.
- English (UK)
- English (India)
- English (Canada)
- English (Australia)
- English (South Africa)
- English (Philippines)
- English (Nigeria)
- Deutsch
- Español (España)
- Español (México)
- Français
- Italiano
- Nederlands
- Português (Portugal)
- Polski
- Português (Brasil)
- Русский
- Türkçe
- العربية
- Ελληνικά
- Svenska
- Suomi
- עברית
- 日本語
- 한국어
- 简体中文
- 繁體中文
- Bahasa Indonesia
- Bahasa Melayu
- ไทย
- Tiếng Việt
- हिंदी
Dow Jones Climbs For Seventh Straight Week
Published 11/24/2013, 12:52 PM
Updated 05/14/2017, 06:45 AM
Dow Jones Climbs For Seventh Straight Week
Latest comments
Loading next article…
Install Our App
Risk Disclosure: Trading in financial instruments and/or cryptocurrencies involves high risks including the risk of losing some, or all, of your investment amount, and may not be suitable for all investors. Prices of cryptocurrencies are extremely volatile and may be affected by external factors such as financial, regulatory or political events. Trading on margin increases the financial risks.
Before deciding to trade in financial instrument or cryptocurrencies you should be fully informed of the risks and costs associated with trading the financial markets, carefully consider your investment objectives, level of experience, and risk appetite, and seek professional advice where needed.
Fusion Media would like to remind you that the data contained in this website is not necessarily real-time nor accurate. The data and prices on the website are not necessarily provided by any market or exchange, but may be provided by market makers, and so prices may not be accurate and may differ from the actual price at any given market, meaning prices are indicative and not appropriate for trading purposes. Fusion Media and any provider of the data contained in this website will not accept liability for any loss or damage as a result of your trading, or your reliance on the information contained within this website.
It is prohibited to use, store, reproduce, display, modify, transmit or distribute the data contained in this website without the explicit prior written permission of Fusion Media and/or the data provider. All intellectual property rights are reserved by the providers and/or the exchange providing the data contained in this website.
Fusion Media may be compensated by the advertisers that appear on the website, based on your interaction with the advertisements or advertisers.
© 2007-2024 - Fusion Media Limited. All Rights Reserved.