Get 40% Off
👀 👁 🧿 All eyes on Biogen, up +4,56% after posting earnings. Our AI picked it in March 2024.
Which stocks will surge next?
Unlock AI-picked Stocks

Dow Industrials Test Super Breakout Price Level

Published 12/03/2020, 12:27 PM
Updated 07/09/2023, 06:31 AM

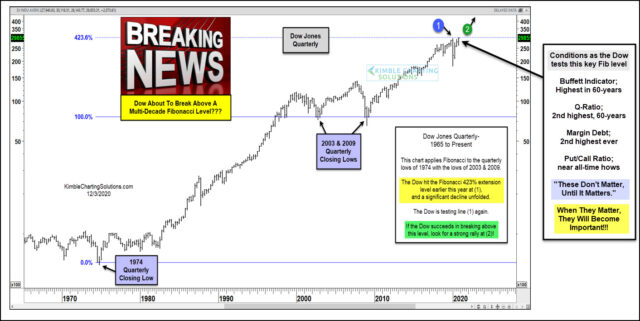
Dow Jones 50-Year Chart.

The Dow Jones Industrial Average has survived several market scares over the past five decades, including the 1987 crash (Black Monday), the tech bubble, the financial crisis and the coronavirus crash.

In a very noisy, news-driven world, sometimes it pays to simply zoom out on the charts and stop thinking about trading every headline.

Today’s chart is a “quarterly” chart of the Dow Jones Industrial Average (spanning the past 50 years). It includes some relevant Fibonacci price levels for active investors to consider; we apply Fibonacci to the quarterly lows of 1974 and the lows of 2003 and 2009 (that being 100%).

Note that the Dow Industrials hit the 423% Fibonacci price extension earlier this year at (1) – roughly 30,000. Note as well that a significant decline followed. The Dow Industrials are testing this level again right now.

If the Dow Industrials succeeds in breaking above 30000 (on a quarterly closing basis) it could signal a super breakout and much higher prices as indicated by point (2).

The box to the right reflects a few extremes that are in play, as the Dow is testing this multi-decade Fibonacci extension level.

As mentioned in the box, these conditions don’t matter, until they matter.

Will they matter sometime? Guaranteed they will somewhere down the line!

Latest comments

Risk Disclosure: Trading in financial instruments and/or cryptocurrencies involves high risks including the risk of losing some, or all, of your investment amount, and may not be suitable for all investors. Prices of cryptocurrencies are extremely volatile and may be affected by external factors such as financial, regulatory or political events. Trading on margin increases the financial risks.
Before deciding to trade in financial instrument or cryptocurrencies you should be fully informed of the risks and costs associated with trading the financial markets, carefully consider your investment objectives, level of experience, and risk appetite, and seek professional advice where needed.
Fusion Media would like to remind you that the data contained in this website is not necessarily real-time nor accurate. The data and prices on the website are not necessarily provided by any market or exchange, but may be provided by market makers, and so prices may not be accurate and may differ from the actual price at any given market, meaning prices are indicative and not appropriate for trading purposes. Fusion Media and any provider of the data contained in this website will not accept liability for any loss or damage as a result of your trading, or your reliance on the information contained within this website.
It is prohibited to use, store, reproduce, display, modify, transmit or distribute the data contained in this website without the explicit prior written permission of Fusion Media and/or the data provider. All intellectual property rights are reserved by the providers and/or the exchange providing the data contained in this website.
Fusion Media may be compensated by the advertisers that appear on the website, based on your interaction with the advertisements or advertisers.
© 2007-2024 - Fusion Media Limited. All Rights Reserved.