The US dollar was seen trading mixed earlier on Monday. Last week, investors grew wary of the proposed tax reforms plans which are expected to be delayed. On the economic front, the calendar was also quiet with only the UK's manufacturing, construction, and industrial output data.
Looking ahead, the economic calendar is quiet today with only BoJ's Kuroda expected to speak later in the evening. The German WPI data is due to come out earlier in the day with forecasts showing that wholesale price index rose 0.4% on the month, rising at a slower pace than the previous month.
EUR/USD Intraday Analysis

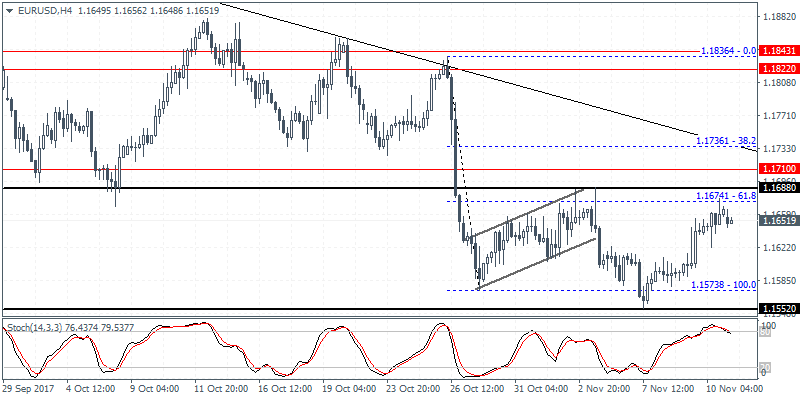
EUR/USD (1.1651):The EUR/USD continued to push higher last week as price briefly tested the resistance level of 1.1674. Price action has since then been pushing lower. In the short term, EUR/USD will maintain the sideways range within 1.1674 level of resistance and 1.1573 level of support. The rally to 1.1674 has invalidated the bearish flag pattern, and we expect the price to remain range bound. Further trend can be seen forming on a breakout above or below the mentioned resistance and support levels.
USD/JPY Intraday Analysis

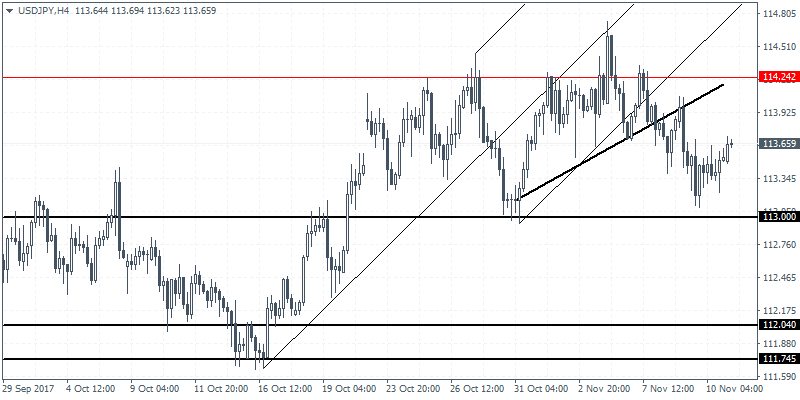
USD/JPY (113.65):The USD/JPY has been slowly consolidating after the decline towards 113.10 level. The brief bounce off this level suggests the sideways range that has been in play. However, we expect price action to complete the decline to the downside and thus testing the support level of 113.00 more firmly. To the upside, the declines are limited towards the resistance and support level of 113.75 region. A breakout above this level on an intraday basis could signal further upside in price that could see a potential test of resistance at 114.24.
XAU/USD Intraday Analysis

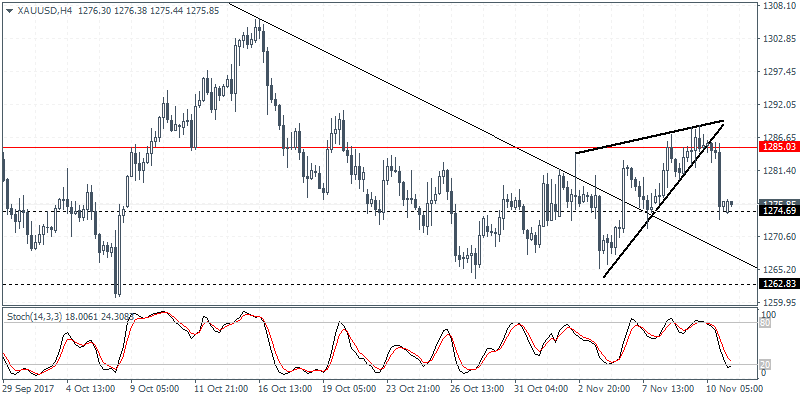
XAU/USD (1275.85):Gold prices fell towards the support level of 1274.69 on Friday. This validated the ascending triangle pattern which saw prices consolidating near the resistance level of 1285.00. The decline to the 1274.69 support level could see prices now attempting to bounce back higher. Thisis also seen with the hidden bullish divergence on the Stochastics which has posted a lower low compared to the higher low in price. In the near term we expect gold prices to maintain the range above 1274.69 and 1285.03. A breakout from either of these levels will, however, signal further continuation in price.
