Get 40% Off
👀 👁 🧿 All eyes on Biogen, up +4,56% after posting earnings. Our AI picked it in March 2024.
Which stocks will surge next?
Unlock AI-picked Stocks

Dollar Looks To A New Week; OPEC Meeting In Focus

Published 05/22/2017, 06:28 AM
Updated 08/29/2019, 07:20 AM

The US dollar index will be looking to a fresh week with the possibility of a rebound following last week's sharp declines. On Friday, the US dollar edged lower with no major economic events to report.

Oil prices were back in the limelight ahead of this week's OPEC meeting on Thursday, 25 May 2017. The OPEC leaders and Russia are widely expected to extend the production cut until March 2018. Oil prices closed at $50.33, rising 2% by Friday's close.

Looking ahead, economic data today is light which puts Fed members Harker and Kashkari's speeches in the limelight.

EUR/USD intraday analysis
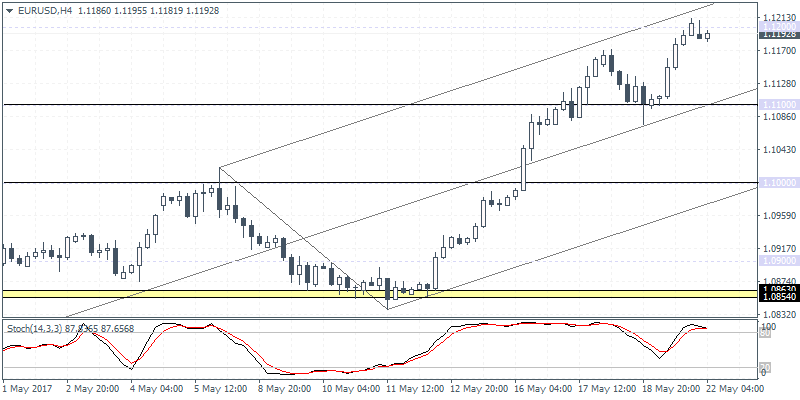
EUR/USD 4 Hour Chart

EUR/USD (1.1192):Following the rally to 1.1200 on Friday, EUR/USD is looking a tad weaker although the price could very well stay range bound in the near term.

The lack of economic data today is likely to put the focus back to the politics from Washington which will put the EUR/USD at risk of further gains above 1.1200. To the downside, immediate support is seen at 1.1100 while further declines can be seen coming on a break down below 1.1100 with a move towards 1.1000. To the upside, support needs to be established at 1.1200 for further gains to be validated.

USD/JPY intraday analysis
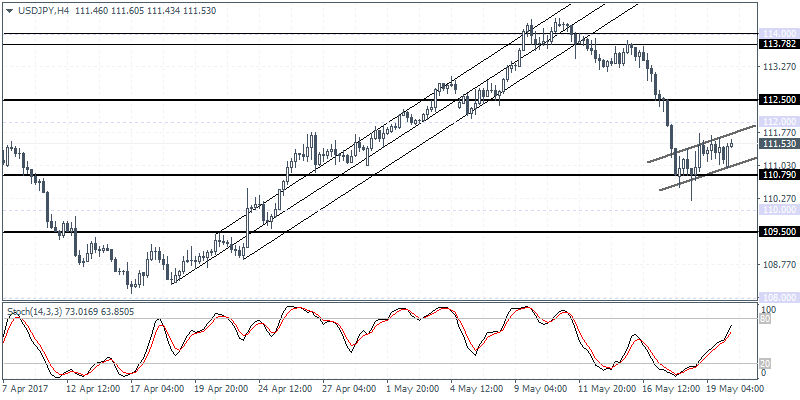
USD/JPY 4 Hour Chart

USD/JPY (111.53):USD/JPY has been pushing higher since the open today, although price action is clearly pointing to a bearish flag pattern as seen on the 4-hour chart.

Resistance is seen likely to form at 112.00 and only above this level can we expect to see some upside gains. To the downside, a break down from the bearish flag pattern is essential at 110.79 which will push the USD/JPY lower towards the next immediate support at 109.50 and 109.00 levels.

3rd party Ad. Not an offer or recommendation by Investing.com. See disclosure here or remove ads .

XAU/USD intraday analysis

XAU/USD Chart

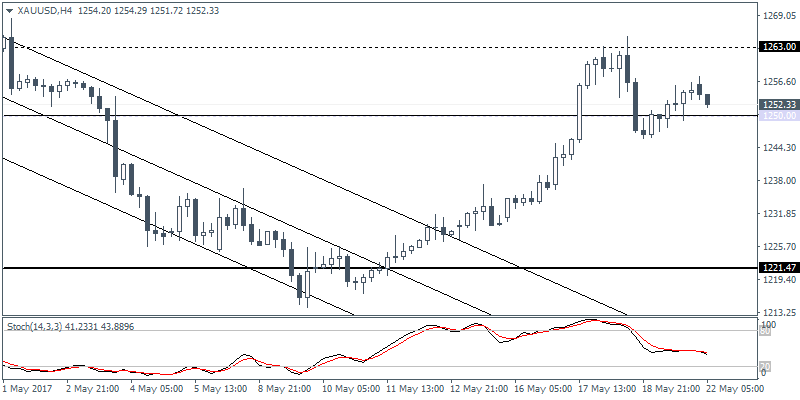
XAU/USD (1252.33):Gold prices continue to consolidate near the 1250 handle following last week's rally towards 1265 highs.

The rising wedge pattern on the daily chart remains in play which could potentially signal a move lower towards 1200.00 potentially. In the near term, gold prices remain range bound within 1263 and 1250 levels and a break down below one of these levels is needed to push gold prices further.

Latest comments

Risk Disclosure: Trading in financial instruments and/or cryptocurrencies involves high risks including the risk of losing some, or all, of your investment amount, and may not be suitable for all investors. Prices of cryptocurrencies are extremely volatile and may be affected by external factors such as financial, regulatory or political events. Trading on margin increases the financial risks.
Before deciding to trade in financial instrument or cryptocurrencies you should be fully informed of the risks and costs associated with trading the financial markets, carefully consider your investment objectives, level of experience, and risk appetite, and seek professional advice where needed.
Fusion Media would like to remind you that the data contained in this website is not necessarily real-time nor accurate. The data and prices on the website are not necessarily provided by any market or exchange, but may be provided by market makers, and so prices may not be accurate and may differ from the actual price at any given market, meaning prices are indicative and not appropriate for trading purposes. Fusion Media and any provider of the data contained in this website will not accept liability for any loss or damage as a result of your trading, or your reliance on the information contained within this website.
It is prohibited to use, store, reproduce, display, modify, transmit or distribute the data contained in this website without the explicit prior written permission of Fusion Media and/or the data provider. All intellectual property rights are reserved by the providers and/or the exchange providing the data contained in this website.
Fusion Media may be compensated by the advertisers that appear on the website, based on your interaction with the advertisements or advertisers.
© 2007-2024 - Fusion Media Limited. All Rights Reserved.