
Despite death wishes from the doubters, the U.S. dollar took to the skies on the Fed’s hawkish wings. Gold and silver can wave from the ground for now.
While Fed Chairman Jerome Powell threw fuel on the fire on Jan. 26, it’s no surprise that the U.S. Dollar Index has rallied to new highs. For example, while dollar bears feasted on false narratives in 2021, I was a lonely bull forecasting higher index values. Likewise, after more doubts emerged in 2022, the death of the dollar narrative resurfaced once again. However, with the charts signaling a bullish outcome for some time, my initial target of 94.5 was surpassed and my next target of 98 is near.
As such, it’s crucial to avoid speculation and wait for confirmation of breakdowns and breakouts. In its absence, the price action often pulls you in the wrong direction.
Remember the supposedly bearish move below 95 when the USD Index moved even below its rising support line? It’s been just 2 weeks since that development.
On Jan. 14, I wrote the following:
In conclusion, 2022 looks a lot like 2021: dollar bears are out in full force and the ‘death of the dollar’ narrative has resurfaced once again. However, with the greenback’s 2021 ascent catching many investors by surprise, another re-enactment will likely materialize in 2022. Moreover, since gold, silver, and mining stocks often move inversely to the U.S. dollar, their 2022 performances may surprise for all of the wrong reasons. As such, while the dollar’s despondence is bullish for the precious metals, a reversal of fortunes will likely occur over the medium term. Given yesterday’s reversal in the USD Index, it’s likely also from the short-term point of view – we could see the reversal and the return of the USD’s rally and PMs’ decline any day or hour now.
Fortunately, if you’ve been following my analyses, the recent price moves didn’t catch you by surprise. What’s next?
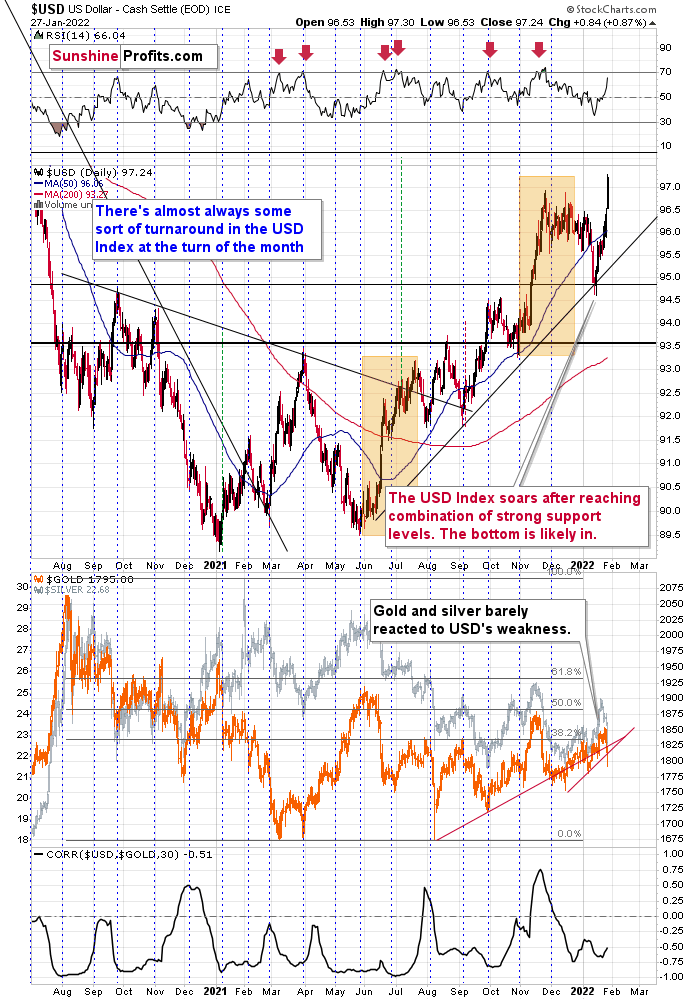
While the USD Index still needs to confirm the recent breakout and some consolidation may ensue, the bullish medium-term thesis remains intact.
More importantly, though, the USD Index’s gain has resulted in gold, silver, and mining stocks’ pain. For example, the dollar’s surge helped push gold below its short-and-medium-term rising support lines (the upward sloping red lines on the bottom half of the above chart).
However, since the USD Index hit a new high and gold didn’t hit a new low, is the development bullish for the yellow metal? To answer, I wrote on Jan. 27:
The U.S. currency just moved above its previous 2022 and 2021 highs, while gold is not at its 2021 lows.
Yet.
I wouldn’t view gold’s performance as true strength against the USD Index at this time just yet. Why? Because of the huge consolidation that gold has been trading in.
The strength that I want to see in gold is its ability not to fall or soar back up despite everything thrown against it, not because it’s stuck in a trading range.
In analogy, you’ve probably seen someone, who’s able to hold their ground, and not give up despite the world throwing every harm and obstacle at them. They show their character. They show their strength. Inaction could represent greater wisdom and/or love and focus on one’s goal that was associated with the lack of action. You probably know someone like that. You might be someone like that.
The above “inaction” is very different from “inaction” resulting from someone not knowing what to do, not having enough energy, or willpower.
Since markets are ultimately created by people (or algorithms that were… ultimately still created by people) is it any surprise that markets tend to work in the same way? One inaction doesn’t equal another inaction, and – as always – context matters.
However, wasn’t gold strong against the USD Index’s strength in 2021?
It was, but it was very weak compared to the ridiculous amounts of money that were printed in 2020 and 2021 and given the global pandemic. These are the circumstances, where gold “should be” soaring well above its 2011 highs, not invalidating the breakout above it. The latter, not the former, happened. Besides, the “strength” was present practically only in gold. Silver and miners remain well below their 2011 highs – they are not even close to them and didn’t move close to them at any point in 2020 or 2021.
The Eye in the Sky Doesn’t Lie
Moreover, if we zoom out and focus our attention on the USD Index’s weekly chart, the price action has unfolded exactly as I expected. For example, while overbought conditions resulted in a short-term breather, the USD Index consolidated for a few weeks. However, history shows that the greenback eventually catches its second wind. To explain, I previously wrote:
I marked additional situations on the chart below with orange rectangles – these were the recent cases when the RSI based on the USD Index moved from very low levels to or above 70. In all three previous cases, there was some corrective downswing after the initial part of the decline, but once it was over – and the RSI declined somewhat – the big rally returned and the USD Index moved to new highs.
Please see below:

Just as the USD Index took a breather before its massive rally in 2014, it seems that we saw the same recently. This means that predicting higher gold prices (or those of silver) here is likely not a good idea.
Continuing the theme, the eye in the sky doesn’t lie, and with the USDX’s long-term breakout clearly visible, the wind remains at the dollar’s back. Furthermore, dollar bears often miss the forest through the trees: with the USD Index’s long-term breakout gaining steam, the implications of the chart below are profound. While very few analysts cite the material impact (when was the last time you saw the USDX chart starting in 1985 anywhere else?), the USD Index has been sending bullish signals for years.
Please see below:

Bottom Line
With my initial 2021 target of 94.5 already hit, the ~98-101 target is likely to be reached over the medium term (and perhaps quite soon) Mind, though: we’re not bullish on the greenback because of the U.S.’s absolute outperformance. It’s because the region is fundamentally outperforming the Eurozone. The EUR/USD accounts for nearly 58% of the movement of the USD Index, and the relative performance is what really matters.
In conclusion, the USD Index’s ascent has surprised investors. However, if you’ve been following my analysis, you know that I’ve been expecting these moves for over a year. Moreover, with the rally poised to persist, gold, silver, and mining stocks may struggle before they reach lasting bottoms. However, with long-term buying opportunities likely to materialize later in 2022, the precious metals should soar to new heights in the coming years.