The U.S. dollar rally paused yesterday, into the FOMC meeting minutes, closing on a bearish note. Price action followed through by gapping lower in Asian trading session this morning as the dollar index is seen approaching 101.75 support level.
The minutes revealed that officials hiked rates largely based on the market reaction to the presidential elections and in anticipation of aggressive fiscal policy under the new government. The meeting minutes were more hawkish than expected and come from the December 13 meeting where the central bank hiked interest rates for a second time by 25 basis points and signaled at least three rate hikes in 2017.
EUR/USD intra-daily analysis

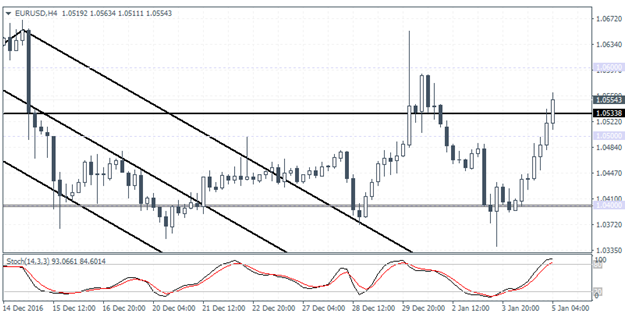
EUR/USD (1.0554) closed bullish in yesterday's session with price action currently extending the gains higher after clearing the 1.0500 resistance level. The euro gained positive momentum yesterday especially after flash inflation estimates showed that headline inflation in the eurozone rose above one percent for the first time in a few years.
The euro also maintained gains on broadly positive composite PMI numbers from December. On the 4-hour chart, price action will need to clear 1.0533 - 1.0500 support level in the term to extend the gains towards 1.0700 eventually. To the downside, the bias could turn flat in the event that EUR/USD makes a daily close below 1.0500, which could keep prices ranging between 1.0500 and 1.0400.
GBP/USD intra-day analysis

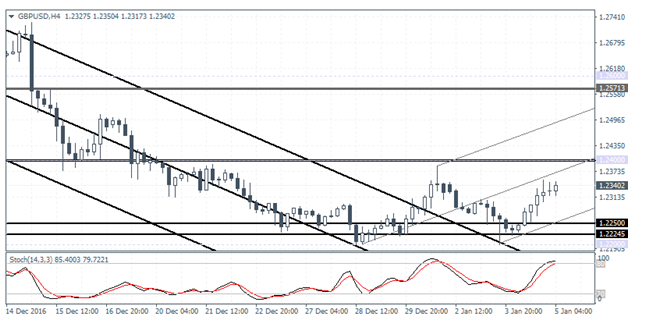
GBP/USD (1.2340) closed bullish yesterday and price action could be seen edging closer to the first obstacle at the immediate resistance level at 1.2400. The brief retest back to the support level at 1.2250 - 1.2224 yesterday, signals that prices have bottomed out in the short term with the current rally likely to push GBP/USD towards 1.2400 with further gains coming above this level.
The longer term target remains at 1.2571 which could be tested for resistance. However, the price will need to establish support at 1.2400 for further gains to be logged. Alternately, GBP/USD could remain range bound within 1.2400 and 1.2250 levels in the near term ahead of tomorrow's U.S. nonfarm payrolls report.
XAU/USD intra-day analysis

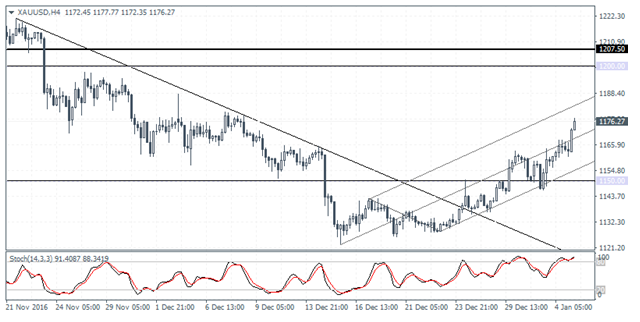
XAU/USD (1176.27) prices have managed to push strongly higher over the holiday season, but the support/resistance level at 1150.00 is likely to be tested ahead of further gains towards 1200.00. The daily chart for gold prices shows a strong hidden bearish divergence that could indicate a near-term pullback to the rally. Thus, 1150.00 makes for an ideal support level that could be tested before gold prices establish resistance at 1200.00. In the event that gold prices fall below 1150.00, further declines could be seen coming which could eventually push gold lower towards the 1100 support levels.
