Here are the latest developments in global markets:
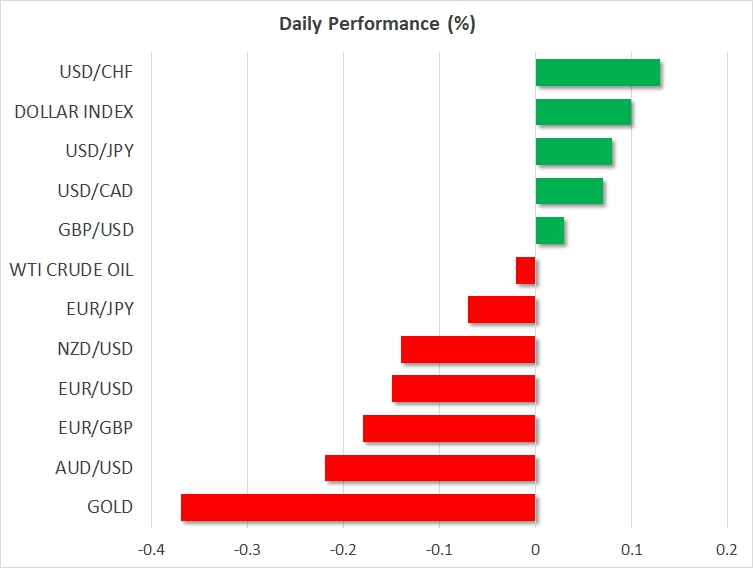
- FOREX: The dollar traded slightly higher versus a basket of currencies after yesterday reaching its lowest since late September. The euro retreated a bit versus the dollar after trading around three-year high levels on Tuesday.
- STOCKS: Hong Kong’s Hang Seng was 0.1% higher, trading at its highest in a decade. Other major Asian indices were in the green, while Japanese markets were closed for a holiday. Euro Stoxx 50 futures were up by 0.3% at 0725 GMT, while Dow, S&P 500 and Nasdaq 100 traded higher by 0.2%, 0.1% and 0.1% respectively. The S&P 500 and the Nasdaq Composite yesterday finished the day at record highs, with the latter gaining the most after strong gains by tech stocks and closing above 7,000 for the first time.
- COMMODITIES: WTI and Brent crude were down, though not by much, trading at $60.32 and $66.51 per barrel respectively after yesterday touching their highest since mid-2015. Gold was 0.4% lower at $1,312.97 after rising in every single trading day since mid-December.
Major movers: Dollar slightly above Tuesday’s low; euro takes breather; sterling momentarily pierces $1.36 level
The dollar index was slightly up at 91.96 after touching 91.75 on Tuesday, its lowest in three-and-a-half months. The US currency was losing ground yesterday even as Treasury yields were on the rise. USD/JPY gained, though not by much as well, trading at 112.36. Yesterday the pair hit 112.04, its lowest since mid-December.
EUR/USD, which was on the forefront yesterday, slipped slightly after touching 1.2082 on Tuesday and coming close to early September’s 1.2092 which is also the highest the pair has reached since the beginning of 2015. Hopes of policy normalization on behalf of the ECB and positive signs for economic activity in the eurozone – December’s manufacturing PMI which was confirmed at 60.6 yesterday constitutes the strongest reading since the series began two decades ago – have been supporting the common currency. The pair was at 1.2042.
GBP/USD was marginally higher, not far below the 1.36 handle after previously piercing through it to record its highest since late September.
The oil-linked Canadian dollar was little changed versus the greenback, trading above the 1.25 level after hitting 1.2496 earlier in the day, its lowest since October 20.
AUD/USD and NZD/USD were down by 0.2% and 0.1%, at 0.7815 and 0.7095 respectively. Despite the decline they both traded around fresh multi-week high levels reached yesterday, benefitting from higher metal prices in recent days.
Day ahead: Dollar awaits FOMC meeting minutes
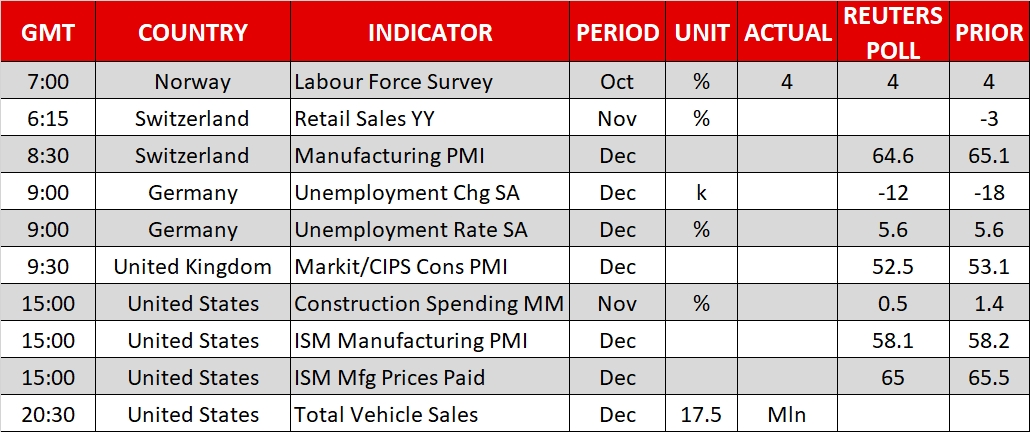
On Wednesday, the Federal Open Market Committee will publish minutes from its latest meeting that took place on December 12-13 at 1900 GMT, with investors being cautious to see whether Fed policymakers continue to support further monetary tightening the next months. Moreover, they will be eager to hear the central bank’s view on the freshly signed US tax legislation and its impact on the country’s economic growth. Any perceived hawkish message is anticipated to push the dollar higher and vice versa.
Earlier at 1500 GMT, the Institute for Supply Management (ISM) will deliver readings on the US manufacturing PMI. The index is expected to inch down by 0.1 points to 58.1 in December. Any value above 50 indicates that the sector is growing and therefore the economy is strengthening.
In the eurozone, Germany’s unemployment rate due at 0900 GMT might bring some volatility to the euro. According to forecasts, the rate is said to remain flat at a record low of 5.6% in December, while the number of unemployed people is forecast to reduce by 12,000 compared to a reduction of 18,000 seen in the previous month.
In energy markets, investors will be waiting for the API weekly report to show changes in the US oil inventories at 2130 GMT.
Technical Analysis: USD/JPY hovers near two-week lows; bearish in short-term
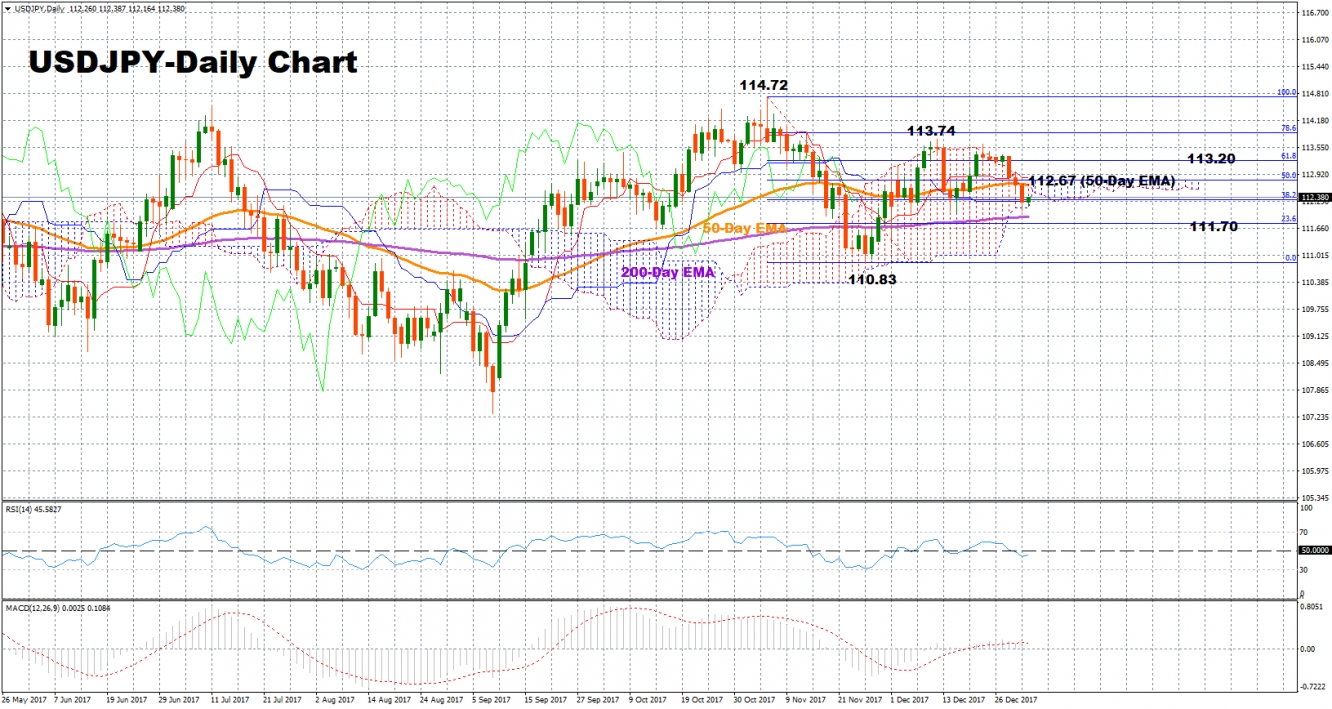
USD/JPY had a disappointing start in the first trading day of 2018, increasing negative momentum as it touched a two-week low of 112.04. In the short -term, the pair holds a bearish bias given that the RSI is currently below its neutral level (50) and the MACD has moved below its trigger line.
Support for further decreases could come at the 200-day exponential moving average at 111.91 and the 23.6% Fibonacci mark at 111.70 of the downleg from 114.72 to 110.83.
A move to the upside might see the 50-day EMA at 112.67, which is marginally below the 50% Fibonacci, acting as resistance. Breaking above this area, the 61.8% Fibonacci at 113.20 could act as another potential barrier before the focus shifts to the previous high of 113.74 and the nine-month high of 114.72.


