
A lot has been said about the usefulness of the New York Stock Exchange’s Advance-Decline line (NYAD) in forecasting the market's direction. Mostly, it is thought to be clear sailing when the NYAD makes a new uptrend high and especially a new all-time high (ATH) while the market has not done so yet. Why?
Supposedly because “breath leads price.”
However, a recent paper by Vincent Randazzo, CMT from Lowry’s research, pointed out: ”While it is often recited in technical analysis circles that ideally, breadth should lead price in healthy uptrends, it is rarely observed. In fact, between 1940 and 2019, there have only been nine observations of this condition. In 1940, after a drawdown of 10% or more, the NYSE Advance-
Decline Line made a new multi-year or all-time high, while the major price indexes were comparatively lower. So, with that myth pretty much debunked, is it also true that with the NYAD making new ATHs it is clear sailing for your investments?
Spoiler alert: “No, not so fast!”
Let us look at the weekly NYAD chart since the bull market in 2009 started. I would like to focus on this timeframe as it allows comparing apples to apples as each bull and bear has often unique and repeating characteristics. Since that low there have been at least 10 corrections, some of which up to over 20%, where the weekly NYAD made a new ATH just prior to these corrections (red boxes and grey arrows). There have only been two occasions where the weekly NYAD made a lower high, while the NYSE made a higher high (2015, 2018: red arrows). Each also led to a 15% and 20% correction. Those two occasions were foreshadowed warnings. The biggest shocker is when the weekly NYAD hit an ATH on the week of Feb. 10, 2020, while the NYSE had already peaked the week of Jan. 13. We all know what followed: the fastest market crash in history and an almost 40% drawdown from the ATHs. So much for “breadth leads price.”
Figure 1: Weekly NYAD and NYSE
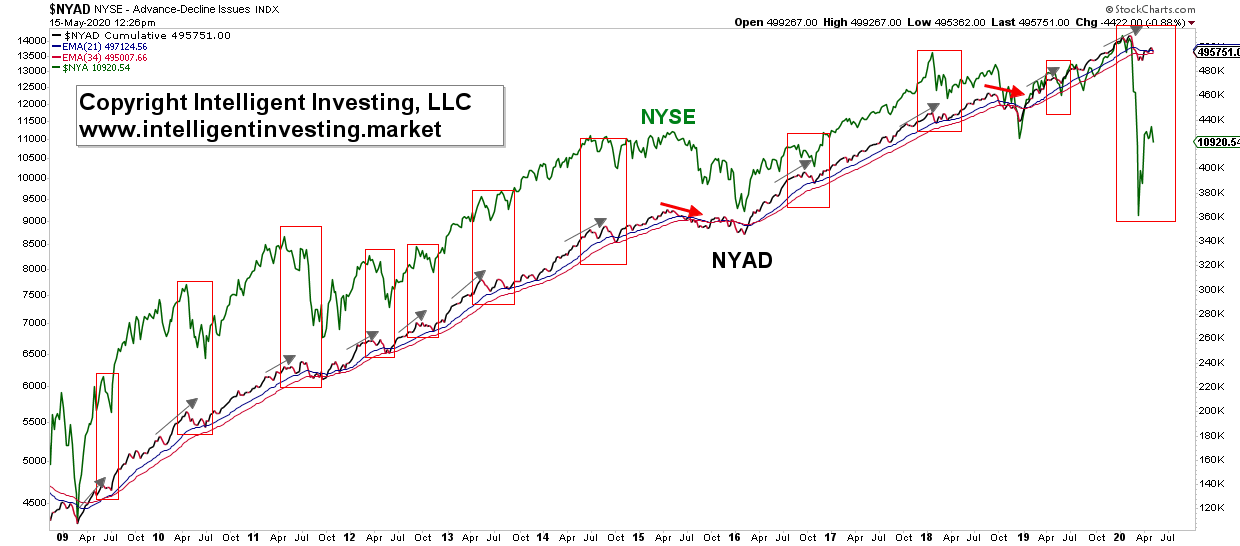
Based on this simple chart and statistics, it is clear the A/D-line is not the magical, one-and-only, will-tell-you-all-you-ever-need-to-know indicator. Did the stock market after each correction continue to make new highs? Sure, it did. The only exception was the current market, where the NYSE has to date only retraced just over 38% of the March crash. But ask yourself: “Is sitting through a 20% corrections the right way to go?” (This can be very scary when you are in it, especially when it happens without any forewarning and one had to rely on this indicator alone.)
In my opinion not, it leads to lost opportunity and wasted time.
For brevity, let me give three examples.
In January 2018, the weekly cumulative NYAD hit a new ATH as did the index. But a 12% correction in less than one month happened in the S&P500. If one had bought that ATH because the A/D lines are making new ATHs, then one would have had to wait six months before returning to the break-even point.
Likewise in 2011. Had one bought the S&P500 based on the NYAD hitting an ATH in July, then you have had to sit through a 21% correction first and wait almost one-and-a-half years before getting back to sustained gains. That is clearly not a proper way to trade and invest. There is too much loss of capital and opportunity.
Of course, the current market is no different: one would still be down ~17% from the February ATH per the S&P500. It is anybody’s guess when the indexes will best their recent ATHs, but if it took prior double-digit corrections many, many months before being back to break even, we can logically assume the markets will take even longer to fully recover from the 30-40% crash in March.
When an indicator cannot help reliably in foretelling a pending 10-20% market correction, or even outright 30-40% crashes, it is simply not reliable. In addition, having to wait many months before getting back to break even on one’s investments and allow for sustained gains, makes its reliability even worse.
Thus, just because the NYAD made an uptrend high, or ATH, does not guarantee it's clear sailing from there on out. In fact, with at least 12 incidents of failing to foretell of larger corrections of up to
almost 40% over the past 11 years, it is clear why I use the weight-of-the-evidence approach in my market analyses. Because using any tool correctly – and not in a vacuum – is important.
For example, the Summation Indices (SIs) are still useful in today’s stock market as they add crucial additional insights on the raw A/D data. Adding moving averages, Elliott Wave Theory and regular technical analysis (trendlines, support/resistance and technical indicators) will only further one’s market insights and increase your odds to be on the right side of the markets when using those insights.
I hope you will treat the A/D lines for what they really are: just another tool among many other tools in your tool kit as a successful trader and certainly not the most important one. Because breadth does most often not lead price.