The positive mood of investors related to the signing of the “first phase” trade agreement between the US and China last month changed to a pessimistic one due to the spread of coronavirus outside of China, which could have an even greater negative impact on the global economy.
Earlier this month, Chinese President Xi Jinping assured US President Trump of China's intention to fulfill the obligations of a recently signed trade deal. At the same time, Jerome Powell, Chairman of the US Federal Reserve System, said that the rapid spread of the virus will inevitably affect the Chinese economy and may affect the US economy.
And so, investors' fears intensified on Tuesday after reports of the further spread of coronavirus and warnings of the US Centers for Disease Control and Prevention (CDC) about a potential pandemic.
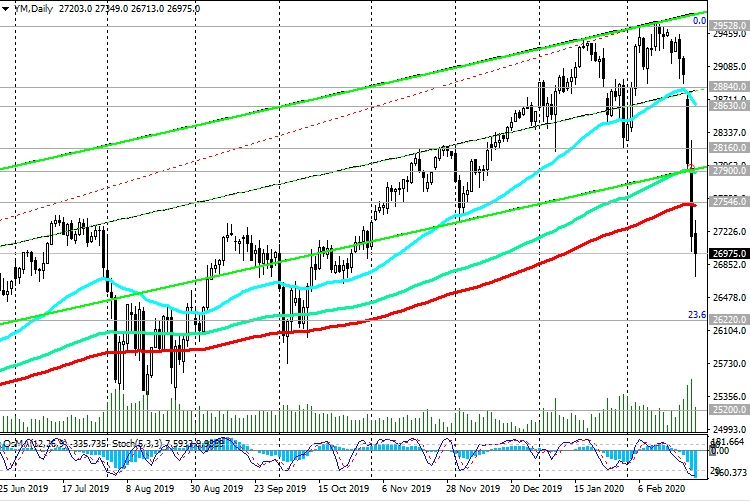
The S&P 500 fell another 0.3% on Tuesday to 3138.00 points, while the NASDAQ Composite lost 2.8%, reaching 8966.00 points, losing growth compared to the beginning of the year. Last week, the DJIA was trading near 29528.0, which corresponds to record and absolute highs. But today, at the beginning of the European session, DJIA futures are trading near the 26900.0 mark, 9.6% below last week's highs.
Protective assets are again in active demand. On Wednesday, the yield on 10-year US government bonds fell at the beginning of the European session to 1.321% (against 1.473% at the end of last week and against 1.576% at the beginning of last week), which corresponds to the lows of 2016. Gold quotes also resumed growth after falling on Tuesday.
DJIA broke through the important support level of 27546.0 (ЕМА200 on the daily chart) and at the beginning of today's European session it is traded near 27070.0.
It is not excluded that the index may decline further to support levels of 26220.0 (Fibonacci level 23.6% of correction to the DJIA growth wave that began in February 2016 from 15500.0), 25200.0 (August lows and ЕМА144 on the weekly chart), 24600.0 (June 2019 lows).
However, only a breakdown of the support level of 24150.0 (EMA200 on the weekly chart and the Fibonacci level 38.2%) can break the DJIA long-term bullish trend.
Growth into the zone above the resistance level of 27546.0 will revive the positive dynamics of the DJIA and once again make long positions relevant.
Support Levels: 26700.0, 26220.0, 25200.0, 24600.0, 24150.0
Resistance Levels: 27546.0, 27900.0, 28160.0, 28630.0, 28840.0, 29528.0
Trading Scenarios
Buy Stop 27350.0. Stop-Loss 26700.0. Take-Profit 27546.0, 27900.0, 28160.0, 28630.0, 28840.0, 29528.0

Sell Stop 26700.0. Stop-Loss 27350.0. Take-Profit 26220.0, 25200.0, 24600.0, 24150.0
