
Let's take a look at the recent developments in the US energy markets and the seemingly contradictory reaction by equity investors.
First of all, while we continue to see significant declines in the US rig count (both oil and gas), ...
 |
| Source: Baker Hughes (NYSE:BHI) |
... American crude oil production remains at record levels and still rising. It's going to take time for this momentum to turn.
 |
| Source: EIA |
Part of the reason is the increasing productivity of new rigs in the US.
 |
| Source: EIA |
Moreover, outside the US some major oil producing nations such as Russia and Iraq - desperate for hard currency - will maximize production in the months to come. Global production will therefore continue to rise.
The second key development has been a relatively steep crude oil futures curve (contango).
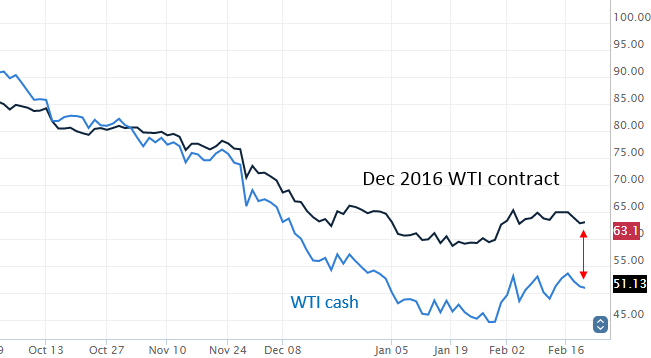 |
| Source: barchart |
This is encouraging crude investors to store oil. The arb involves buying spot crude, simultaneously selling forward, and storing for delivery at a future date (Profit = Forward Price - Spot Price - Storage Cost - Financing Cost). If the arb persists, the trade can be rolled. That's why this past week we saw the largest spike in volume of crude in storage.
 |
| Source: Investing.com |
Moreover, the absolute levels of crude in storage are now at the highest level in some 80 years.
 |
| Source; EIA |
As a result, analysts expect Cushing, OK (the WTI crude delivery/storage hub) to run out of storage soon.
 |
| Source: @jenrossa |
Crude in storage is on the rise outside the US as well. As an example, Iran just launched a huge floating oil storage unit in the Persian Gulf (built by Samsung). This facility stores 2.2 million barrels of crude.
The most important development in 2014 of course was the historic shift in the crude oil production cost curve, capping crude prices at $75-$80/bbl for some years to come.
 |
| Business Insider: @themoneygame |
Now, with these production fundamentals in place, rapidly growing amounts of crude in storage, and longer-term prices capped way below milti-year averages, why are energy firms' shares still relatively expensive? For example, over the past couple of years spot crude oil is down 45%, while the energy component of the S&P 500 is up 2% (via SPDR Energy Select Sector Fund (ARCA:XLE)).

And forward P/E ratios are more than double the historical averages - these are some of the most expensive large cap shares in the market.

Equity markets seem to be betting on a quick decline in production and sufficient recovery in crude prices to return the energy industry to stronger profitability in the nearterm. There is also the view that some energy firms will remain resilient due to their midstream operations - storage, transport, and refining. And we've all heard talk of consolidation and M&A activity in the space which may also support share prices (see story). A number of analysts have turned constructive on the sector.
 |
| Source: Goldman Sachs (NYSE:GS) |
Furthermore, from the technical perspective many portfolio managers have been heavily underweight the energy sector for months and some believe that the eventual rebalancing will drive up share prices.
These are all solid arguments. However given the current lofty valuations, if we don't see a major improvement in crude prices in the next few months, energy shares may take another leg down. One can see this nervousness in the credit markets as HY energy credits remain near historical wides to the rest of the market (chart below). For those who wish to jump in at these levels, be prepared for significant volatility and deleveraging in the energy sector.
 |
| Source: Credit Suisse |
_________________________________________________________________________