S&P 500 at 8,000, gold at $5,400, Tesla to double: Here are top trades for 2026
If you have been following us regularly, you must have noticed how often we use the word “divergence” in our analyses, usually when expecting a trend reversal. A divergence occurs when the price reaches a new extreme, while the line of the indicator, which measures the force behind the price move, does not. It means that despite the new top or low, the current trend is exhausted and might be about to end soon. Oscillator indicators are the best tool to spot a divergence. In our opinion, the relative strength index or RSI, the MACD and Momentum are the best ones.
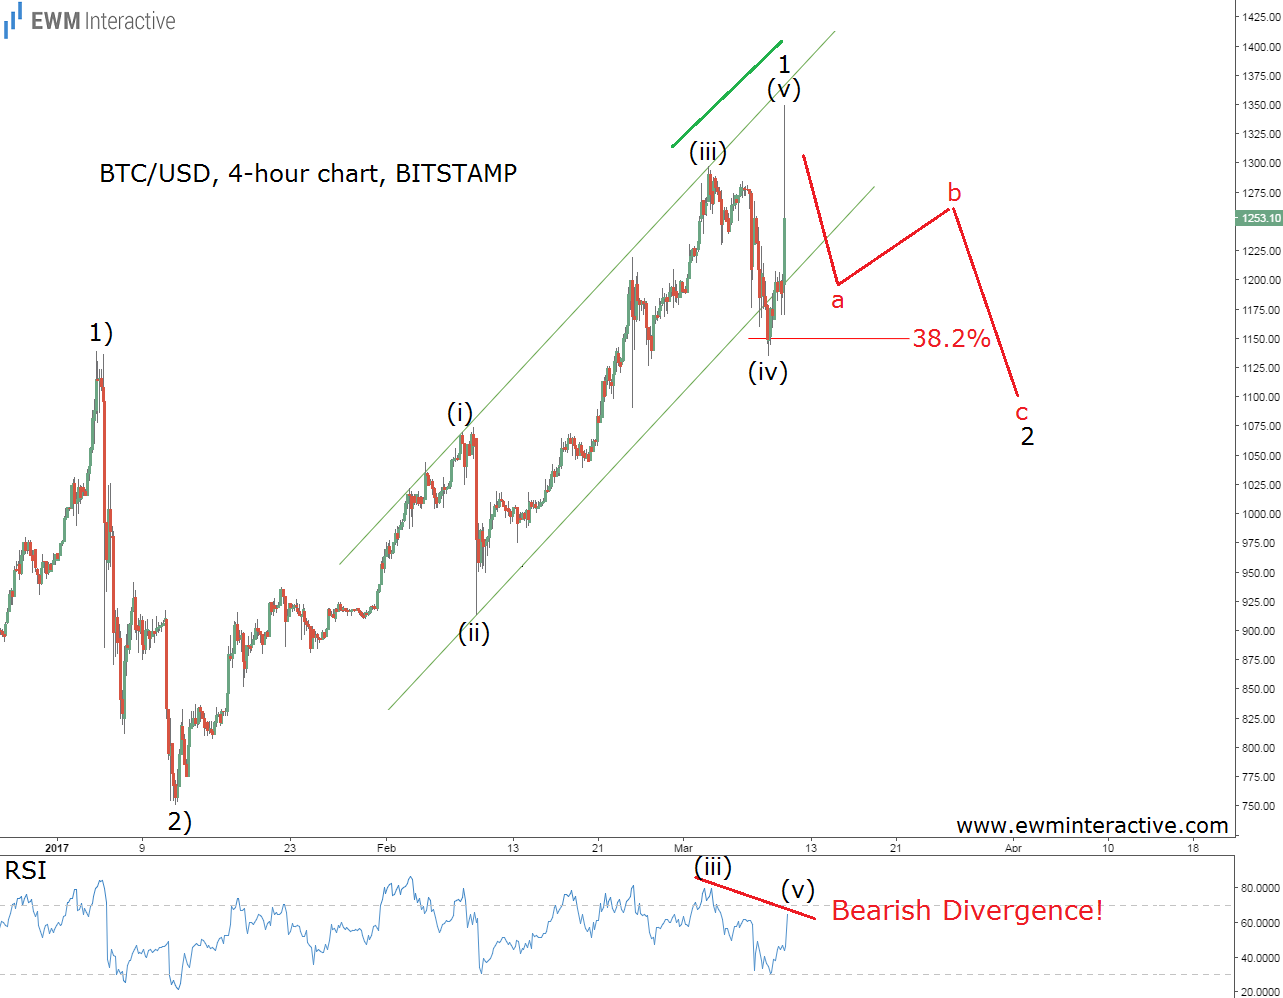
Technical analysis is best understood by looking at a chart, so let’s go straight to it. The one below shows a bearish divergence with the RSI between the last two tops in Bitcoin.
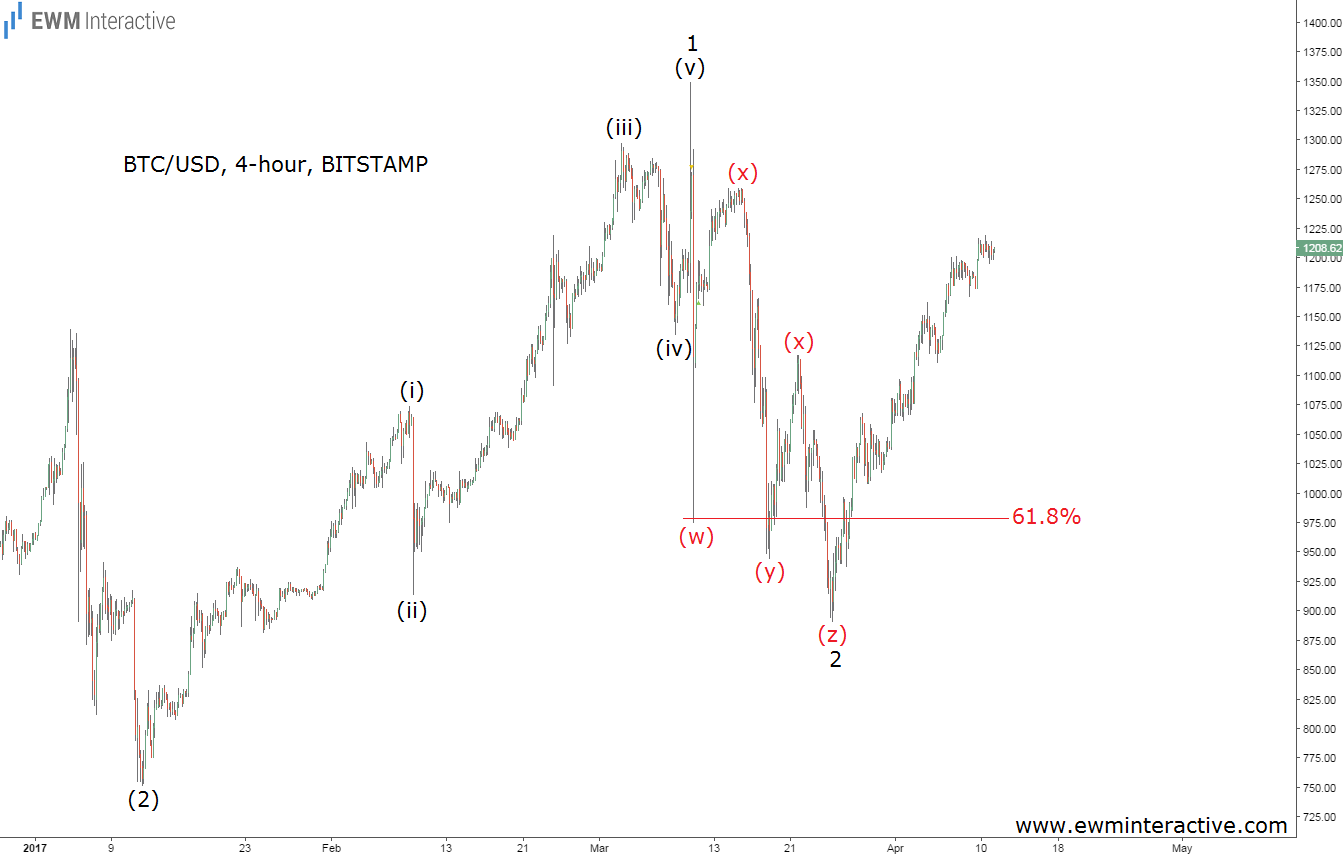
In that case, Elliott Wave analysis suggested we should get ready for a significant pullback, since every five-wave impulse is a followed by a three-wave correction. The bearish odds were further improved by the RSI, which allowed us to recognize a bearish divergence between wave (v) and wave (iii). Wave (v) exceeds the top of wave (iii) in terms of price, but the RSI fails to achieve a new extreme. That is a divergence. The chart below shows what the price of bitcoin did next.
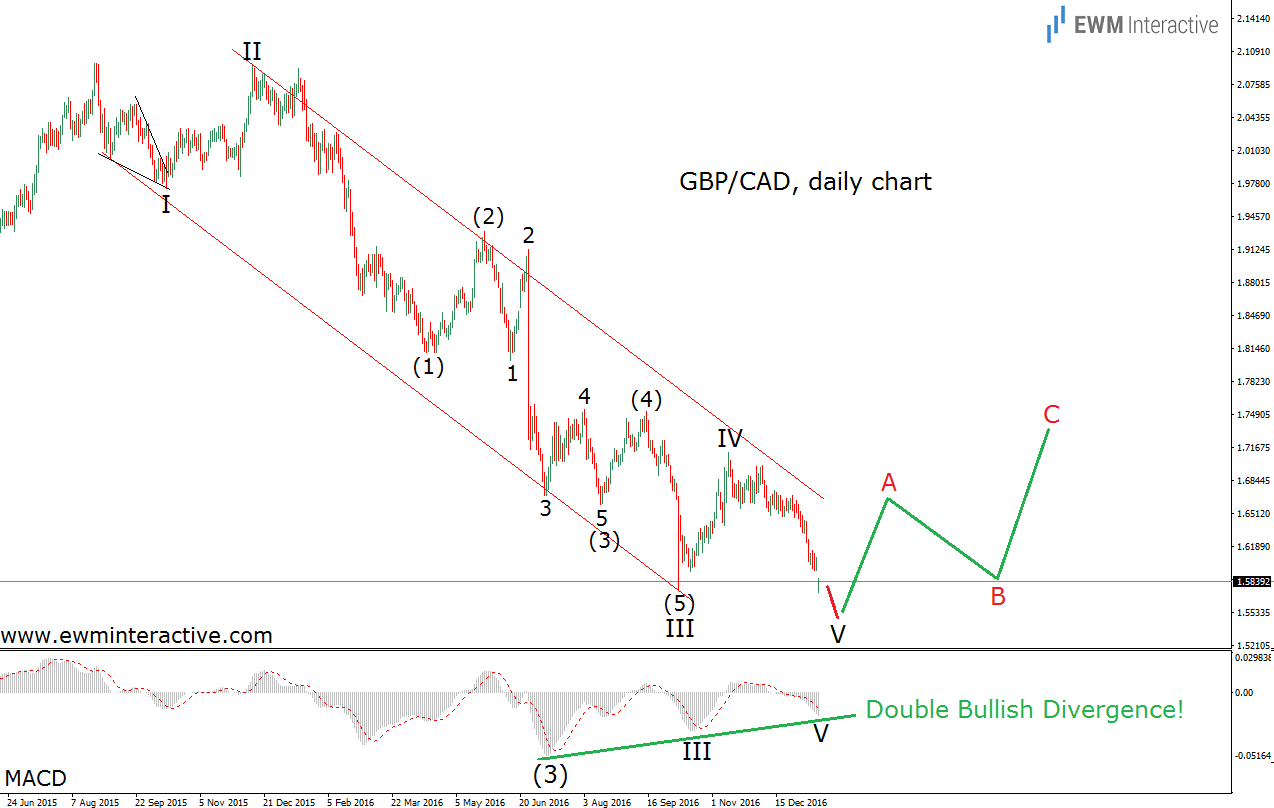
Bitcoin plunged from $1350 to as low as $891, following the SEC’s decision to stop two bitcoin ETFs from being created. Fortunately, Elliott Wave and the RSI divergence warned us about it. That is how you spot a divergence within an uptrend. The chart of GBP/CAD below demonstrates a MACD divergence in a downtrend.
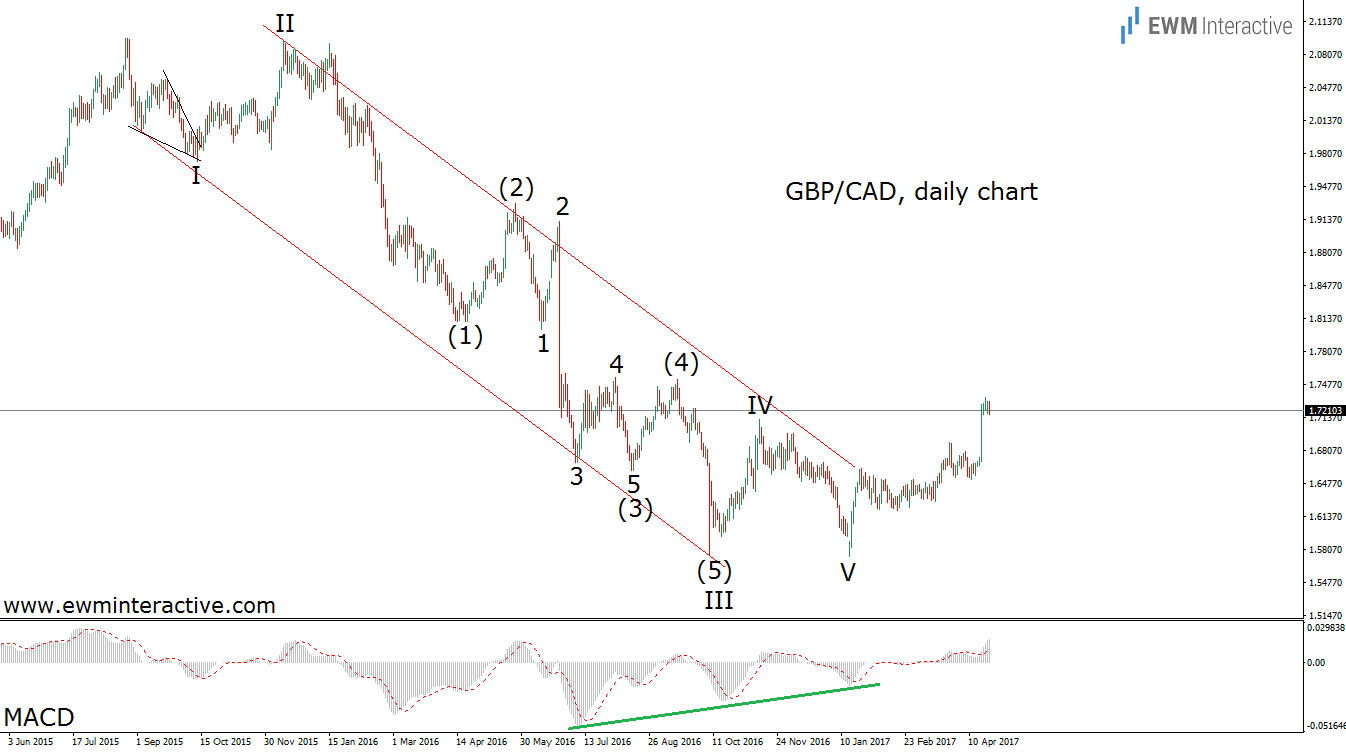
This time, the five-wave pattern was pointing south, so the three-wave correction was supposed to take the pair higher. In addition, the MACD indicator made a double bullish divergence visible. As you can see, the indicator’s lowest bottom corresponded to the low of wave (3) of III. It failed to reach new depths in waves (5) of III and V, suggesting a major recovery might follow.
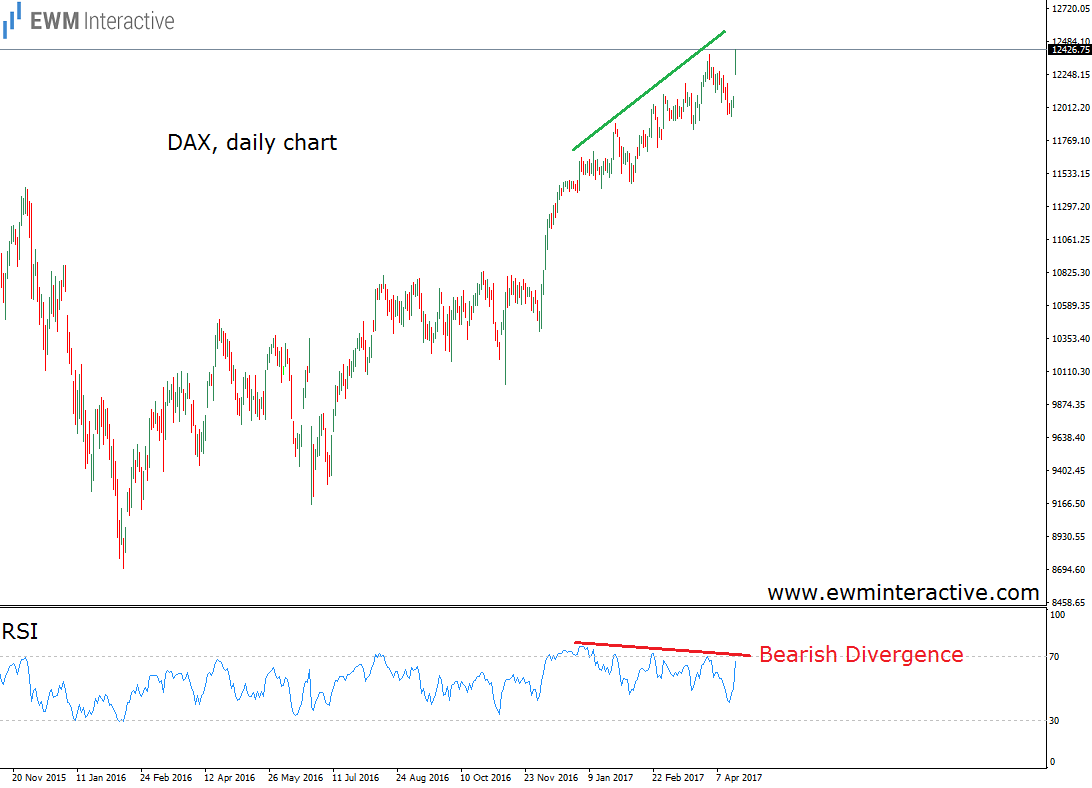
GBP/CAD rose from 1.5736 to as high as 1.7339, giving us another reason to continue using oscillators, in order to support the analysis. But does this mean we could use a divergence as a trading signal. Definitely not. Calling tops or bottoms remains extremely risky, no matter how many indicators suggest the trend is about to change its direction. The above-shown examples might be very impressive, but keep in mind that the market could always ignore the technical indicators and simply continue in the same direction. Doubt it? Take a look at the chart of the German DAX.
The DAX just keeps rising, despite the fact that the RSI started diverging three months ago. That is why traders should not base their trading decisions solely on indicators. All they do is indicate that the current trend is running out of gas. Spotting a divergence does not mean the road is closed. It is more like a “proceed with caution” or “ignore at your own risk” sign.

