
Disney (NYSE:DIS) reported first-quarter fiscal 2020 adjusted earnings of $1.53 per share, beating the Zacks Consensus Estimate by 7% but decreasing 16.8% year over year.
Notably, on Mar 20, Disney acquired Twenty-First Century Fox (TFCF) for cash and issuance of 307 million shares. The quarterly results include TFCF and Hulu LLC (Hulu) results and the consolidations have affected earnings before purchase accounting by 27 cents.
Revenues jumped 36.3% from the year-ago quarter to $20.89 billion, lagging the consensus mark by 1.1%. The year-over-year growth was driven by solid top-line performance across all segments, particularly the Studio Entertainment and Direct-to-Consumer (DTC) businesses.
However, higher operating losses in the DTC segment and Media Networks’ operating income decline hurt profitability.
The Walt Disney Company Price, Consensus and EPS Surprise
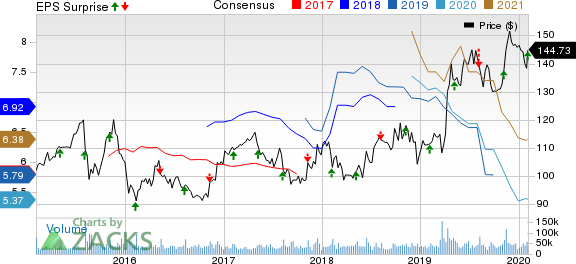
The Walt Disney Company price-consensus-eps-surprise-chart | The Walt Disney Company Quote
Media Networks Segment Details
Media Networks’ (35.3% of revenues) revenues grew 24.3% year over year to $7.36 billion. Revenues from Cable Networks increased 19.6% to $4.77 billion. Broadcasting revenues were up 34.1% year over year to $2.60 billion.
Media Networks’ segment operating income increased 22.6% year over year to $1.63 billion. Cable Networks’ operating income grew 16% to $862 million. Broadcasting operating income surged 40% to $377 million.
Cable Networks’ operating income increased owing to the addition of the TFCF businesses (mainly the FX and National Geographic networks), partially offset by a decrease in ESPN.
ESPN’s domestic linear advertising revenues declined 4.5% due to lower average viewership primarily for NBA and college football regular-season games. Moreover, ESPN’s results were negatively impacted by higher programming, production and marketing costs, somewhat negated by an increase in affiliate revenues.
Higher programming costs were driven by rate increases for NFL, College Football Playoffs and other college sports programming as well as increased costs for the ACC Network, launched in August 2019.
Affiliate revenues benefited from contractual rate increases, partially offset by a decline in subscribers.
The increase in broadcasting operating income was driven by the TFCF consolidation. However, revenues were negatively impacted by lower advertising revenues, a decrease in ABC Studios program sales, and higher network programming and production costs.
Parks, Experiences and Products
The segment revenues (35.5% of revenues) increased 8.4% year over year to $7.40 billion.
Operating income rose 8.6% to $2.34 billion, driven by robust contributions from Consumer Products (merchandise licensing) and domestic parks and resorts (revenues up 10%), partially offset by lower revenues from international parks and resorts.
Consumer Products operating income grew 25% year over year, primarily driven by higher licensing revenues from the Frozen, Star Wars and Toy Story merchandise, partially offset by a decrease in the Mickey and Minnie merchandise.
Operating income growth at domestic parks and resorts (up 6%) was primarily owing to higher guest spending, driven by increases in average ticket prices and higher food, beverage and merchandise spending.
However, the growth in operating income was somewhat negated by expenses associated with Star Wars: Galaxy’s Edge, which was opened on May 31, and negative impact of wage increases for union employees.
Studio Entertainment Details
Studio Entertainment segment (18% of revenues) revenues surged 106.4% to $3.76 billion.
Operating income soared 206.8% to $948 million, backed by higher theatrical and TV/SVOD distribution results, partially muted by the TFCF business losses.
Theatrical distribution revenues benefited from the solid performance of Frozen II and Star Wars: The Rise Of Skywalker.
The 21CF business operating losses ($50 million) resulted from a loss in theatrical distribution, primarily due to the lackluster performance of Spies in Disguise, Ford v. Ferrari (NYSE:RACE) and Terminator: Dark Fate.
Direct-to-Consumer (DTC) & International Interactive Media
The segment (17.9% of revenues) revenues came in at $3.99 billion, significantly up from $918 million in the year-ago quarter.
ESPN+ had more than 6.6 million paid subscribers at the end of the fiscal first quarter. Disney+, launched on Nov 12, gathered 26.5 million paid subscribers. Hulu ended the quarter with 30.4 million paid subscribers.
The average monthly revenue per paid subscriber for ESPN+ declined 4.9% year over year to $4.44 due to a shift in the mix of subscribers to Disney’s bundled offering.
Notably, in November 2019, the company began offering a bundled subscription package of Disney+, ESPN+ and Hulu, which has a lower average retail price per service compared to the average retail price of each service on a standalone basis.
The average monthly revenue per paid subscriber for Disney’s Hulu SVOD Only service declined 9.2% year over year to $13.15, driven by lower retail pricing and a shift in the mix of subscribers to the company’s bundled offering.
The average monthly revenue per paid subscriber for Disney’s Hulu Live TV + SVOD service increased 13.7% from the year-ago quarter to $59.47 owing to higher retail pricing.
Operating loss widened to $693 million from $136 million in the year-ago quarter. Consolidation of Hulu and ongoing investments in ESPN+ and Disney+ affected profitability.
Increase in operating loss at ESPN+ was primarily due to higher programming costs, mainly for the Ultimate Fighting Championship rights, and an increase in marketing spending.
Other Quarter Details
Costs & expenses surged 51.6% year over year to $18.02 billion in the reported quarter.
Selling, general & administrative expenses jumped 72.1% from the year-ago quarter to $3.70 billion.
Segment operating income increased 9.5% year over year to $4 billion. Consolidation of Hulu and intersegment eliminations marred profit by almost $300 million.
Free cash flow at the end of the quarter was $292 million compared with free cash flow of $904 million reported in the year-ago quarter.
Outlook
Disney expects second-quarter fiscal 2020 operating income to be negatively impacted by park closure at Shanghai and Hong Kong due to coronavirus. While the Shanghai closure is expected to hurt operating income by $135 million, Hong Kong’s closure will result in a negative impact of roughly $145 million.
Notably, so far this quarter, Disney’s domestic resort reservations have risen 4% year over year.
Management expects the DTC & International segment to report roughly $900 million in operating losses for the second quarter. Moreover, continued investment in DTC services, particularly Disney+, and the consolidation of Hulu are expected to hurt DTC & International segment’s operating income by $520 million on a year-over-year basis.
Notably, Disney is set to launch Disney+ in India through the Hotstar service on Mar 29. The company will launch Disney+ in several international markets, starting with Western Europe on Mar 24.
Disney projects the 21CF acquisition and the impact of taking full operational control of Hulu to hurt fiscal second-quarter earnings before purchase accounting by 25 cents.
The Zacks Consensus Estimate for fiscal second-quarter earnings is currently pegged at $1.42 per share, indicating a decline of 11.8% from the figure reported in the year-ago quarter.
Zacks Rank and Stocks to Consider
Currently, Disney carries a Zacks Rank #3 (Hold).
Fox Corporation (NASDAQ:FOXA) , Liberty Global (NASDAQ:LBTYA) and ViacomCBS (NASDAQ:VIAC) are stocks worth considering in the broader Consumer & Discretionary sector. All three stocks carry a Zacks Rank #2 (Buy). You can see the complete list of today’s Zacks #1 Rank (Strong Buy) stocks here.
Fox, Liberty Global and ViacomCBS are scheduled to report quarterly results on Feb 5, 13 and 20, respectively.
Biggest Tech Breakthrough in a Generation
Be among the early investors in the new type of device that experts say could impact society as much as the discovery of electricity. Current technology will soon be outdated and replaced by these new devices. In the process, it’s expected to create 22 million jobs and generate $12.3 trillion in activity.
A select few stocks could skyrocket the most as rollout accelerates for this new tech. Early investors could see gains similar to buying Microsoft (NASDAQ:MSFT) in the 1990s. Zacks’ just-released special report reveals 8 stocks to watch. The report is only available for a limited time.
See 8 breakthrough stocks now>>
The Walt Disney Company (DIS): Free Stock Analysis Report
Liberty Global PLC (LBTYA): Free Stock Analysis Report
Fox Corporation (FOXA): Free Stock Analysis Report
CBS Corporation (NYSE:CBS_old) (VIAC): Free Stock Analysis Report
Original post
Zacks Investment Research