Ask 10 people what is the definition of unemployment, and you will get 10 different answers. The tragedy is that it is likely no person’s definition will match the definition used in the creation of the headline unemployment rate from the Bureau of Labor Statistics (BLS). And the methodology the BLS uses does not match the reporting methodology used in other countries.
The real purpose of unemployment data for economists and central bankers is to determine employment slack.
Econintersect has long stated that the way to view unemployment was by using employment-population ratio (the proportion of the civilian non institutional population aged 16 years and over that is employed).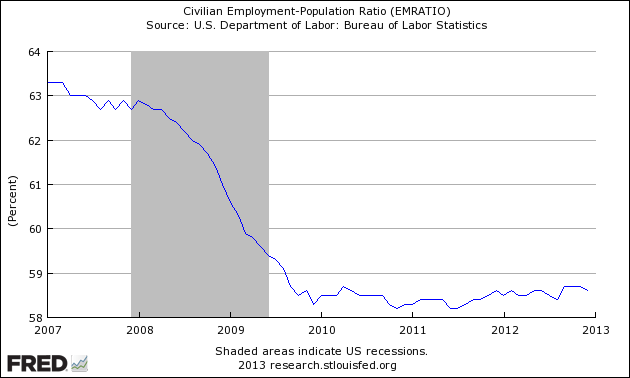
This ratio is telling me that the REAL employment situation is not improving, as the percentage of the population with a job is not growing. It should be difficult to distort this ratio unless you change the definition of the ratio.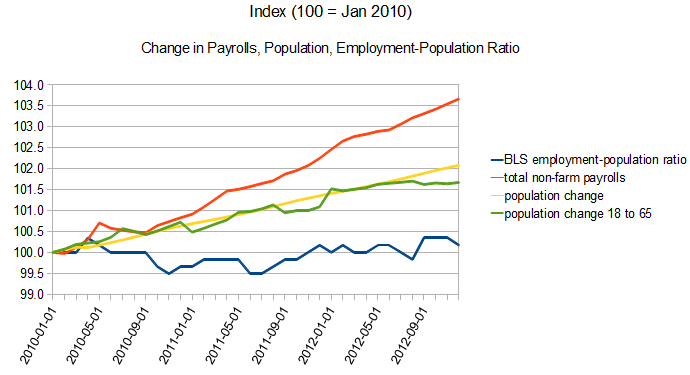
The BLS’s employment-population ratio (blue line in above graph) has changed little since 2010, yet employment (red line in above graph) is growing almost twice as fast as population growth. And to add to the mystery, the population between 18 to 65 (green line on above graph) has not grown in 2012. The overall population growth (yellow line in above graph) since Jan 2010 has been 7.5 million with 4.3 million of that growth in 65+.
The above graph really is a puzzle.
- Should the USA consider people 65+ part of the employable population? The working age is considered ages 15 to 64 in most OECD countries – and the BLS uses 16+.
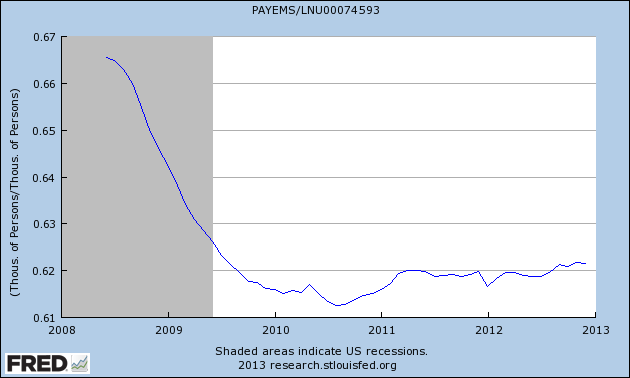
- The BLS produces the employment-population ratio by survey (Household Survey). Why is it essentially unchanged over 3 years when headline employment is rising twice the rate of the population growth? The chart below is all non-farm employees divided by the Civilian Non-institutional Population – With No Disability, 16 years and over (in other words – the employment – population ratio). This chart shows a meager growth trend since the trough in 2010 – and this does not match the trend lines for the BLS employment – population ratio. But this graph is not produced by the Household Survey data, but by the Establishment Survey data.
Another aspect of this discussion on the the employment-population ratios is the demographic shift from young to old. The elderly are distorting the employment statistics because increased numbers of those 65 and older are still working. According to the BLS, in 2002 2.4 million men 65 and older were working; in 2012 that number had increased to 4.2 million. The employment/population ratio for men 65+ in the early 2000s was ~17%. By the early 2010s the ratio was more than 40% higher (~24%).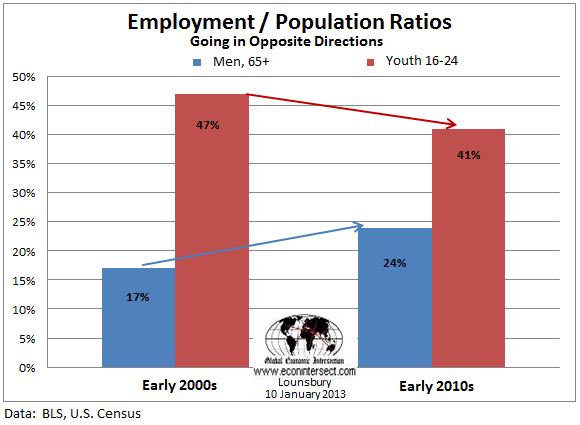
Youth employment has been going in the opposite direction, with the employment population ratio going from ~47% to ~41% employed over the same decade. The graph below shows how the aged end of the population is taking a larger share of the jobs than historically – red line is employment growth, blue line is population growth.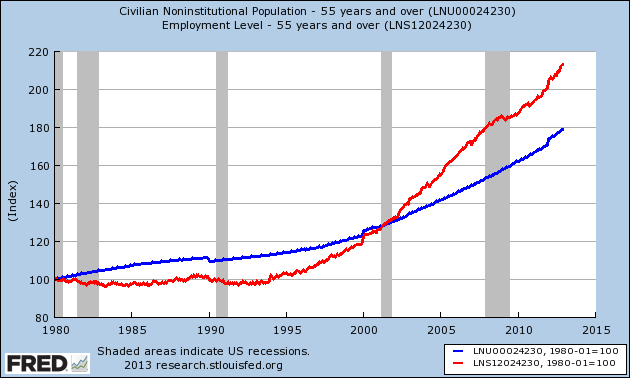
And of course, the younger end of the population is doing the opposite – losing share of employment growth. In graph below, red line is employment growth, blue line is population growth.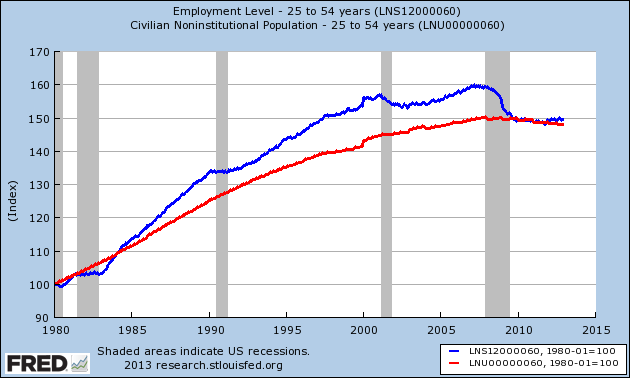
The headline unemployment number is currently 7.8% which is just where it was 4 years ago. Yet the percent of the population employed is much lower. Am I to understand people that 12 million people are no longer interested in working? For an eye opener, take a look at what is considered normal employment – population ratios in OCED countries. “In general, a high ratio is considered to be above 70% of the working-age population whereas a ratio below 50% is considered to be low.” The USA is at 58.7%.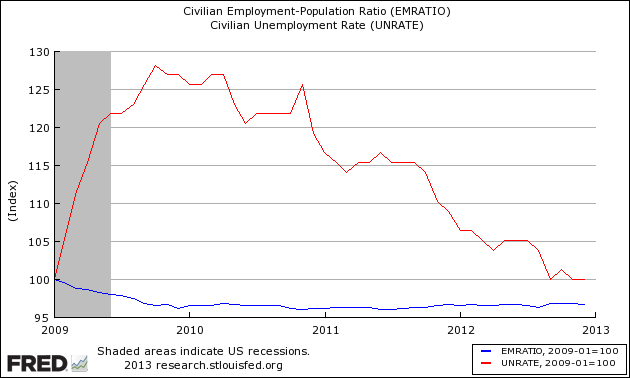
Should we believe the employment situation is returning to normal? Is the Federal Reserve basing their monetary policy decisions on the employment situation on the headline 7.8% unemployment number? Is the 7.8% really measuring employment slack, or is this an artificial number?
Garbage in, garbage out.
Other Economic News this Week:
The Econintersect economic forecast for January 2012 shows weak growth. The underlying dynamics have a whiff of improvement – as underlying trends seemed to have stabilized with some marginally improving. Most of the recession markers have evaporated, and one of our alternate methods to validate our forecast remains recessionary (but now only slightly so). All in all, still not a great forecast – but at least there is hope that conditions will be improving in the months to come.
ECRI believes the recession began in July 2012. ECRI first stated in September 2011 a recession was coming . The size and depth is unknown. The ECRI WLI growth index value has been weakly in positive territory for over three months. The index is indicating the economy six month from today will be slightly better than it is today.
Current ECRI WLI Growth Index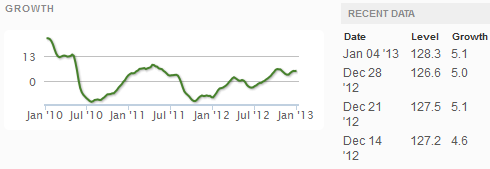
Initial unemployment claims fell from 372,000 (reported last week) to 371,000 this week. Historically, claims exceeding 400,000 per week usually occur when employment gains are less than the workforce growth, resulting in an increasing unemployment rate (background here and here).
The real gauge – the 4 week moving average – continued to fall from 360.000 (reported last week) to 365,750. Because of the noise (week-to-week movements from abnormal events AND the backward revisions to previous weeks releases), the 4-week average remains the reliable gauge.
Weekly Initial Unemployment Claims – 4 Week Average – Seasonally Adjusted – 2010 (blue line), 2011 (red line), 2012 (green line)
Bankruptcies this Week: K-V Pharmaceutical
Data released this week which contained economically intuitive components(forward looking) were:
- Rail movements (where the economic intuitive components indicate a moderately expanding economy).
All other data released this week either does not have enough historical correlation to the economy to be considered intuitive, or is simply a coincident indicator to the economy.
Weekly Economic Release Scorecard:
Click here to view the scorecard table below with active hyperlinks
