
Deere & Company (NYSE:DE) reported fourth-quarter fiscal 2018 (ended Oct 28, 2018) adjusted earnings of $2.30 per share, missing the Zacks Consensus Estimate of $2.44 by a margin of 6%. Deere’s shares lost around 3.6% in pre-market trading following the release owing to lower-than-expected results and tepid outlook. 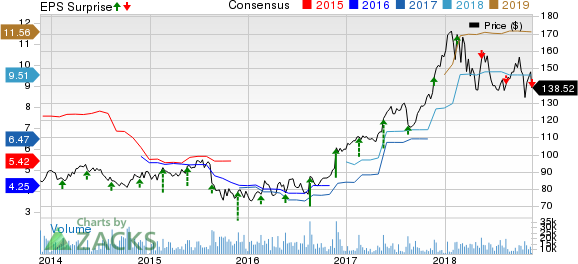

Mobile Mini, Inc. (MINI): Free Stock Analysis Report
Cintas Corporation (CTAS): Free Stock Analysis Report
Deere & Company (DE): Free Stock Analysis Report
Enersys (ENS): Free Stock Analysis Report
Original post
Zacks Investment Research
Including tax adjustments related to the tax reform, the company reported earnings of $2.42 per share compared with the year-ago quarter’s figure of $1.57 per share. Third-quarter performance benefited from favorable market conditions and positive customer response to the company’s product lineup comprising advanced technology and product features. Further, cost management and pricing actions to counter cost pressures for raw materials and freight aided results.
Net sales of equipment operations (which comprise Agriculture and Turf, Construction and Forestry) came in at $8.3 billion, surging 18% year over year. Revenues missed the Zacks Consensus Estimate of $8.59 billion.
The acquisition of the Wirtgen Group in December 2017 added 11% to net sales in the fiscal fourth quarter. Gain from price realization of 2% was offset by an unfavorable currency translation impact of 3%. Region wise, equipment net sales increased 21% in the United States and Canada, and 13% in the rest of the world. Total net sales (including financial services and others) came in at $9.4 billion, up 17% year over year.
Deere & Company Price, Consensus and EPS Surprise
Deere & Company price-consensus-eps-surprise-chart | Deere & Company Quote
Operational Update
Cost of sales in the quarter increased 18% year over year to $6.4 billion. Gross profit in the reported quarter came in at $1.96 billion, advancing 16% year over year. Selling, administrative and general expenses increased 6% year over year to $899 million. Equipment operations reported operating profit of $862 million in the quarter compared with $680 million in the prior-year quarter.
The Wirtgen acquisition contributed $79 million to the operating income in the quarter under review. Apart from the contribution from the Wirtgen acquisition, higher shipment volumes, price realization and lower warranty costs also drove results. However, these gains were partially offset by higher production costs, research and development expenses and unfavorable effects of foreign currency exchange. Total operating profit (including financial services) increased to $1.06 billion from $0.8 billion reported in the year-ago quarter.
Segment Performance
Agriculture & Turf segment’s sales were up 3% year over year to $5.6 billion, primarily driven by higher shipment volumes and price realization offset by an unfavorable currency-translation impact. Operating profit at the segment declined 5% year over year to $567 million, owing to higher production costs, unfavorable effects of foreign-currency exchange and higher research and development costs, partially mitigated by higher shipment volumes and price realization.
Construction & Forestry sales increased 65% year over year to $2.74 billion from the prior-year quarter, aided by the Wirtgen acquisition, higher shipment volumes, price realization and lower warranty-related claims somewhat offset by unfavorable foreign exchange. This segment reported operating profit of $295 million, up a whopping 243% year over year. The Wirtgen acquisition contributed operating profit of $79 million for the quarter. The above-mentioned factors that led to sales growth were instrumental in driving the improvement in operating profit. However, higher production costs were a deterrent.
Net revenues at Deere’s Financial Services division totaled $851 million in the reported quarter, up 9% year over year. The segment’s operating profit came in at $201 million, an increase of 1% year over year.
Financial Update
Deere reported cash and cash equivalents of $3.9 billion at the end of the fiscal 2018 compared with $9.3 billion at the end of the prior fiscal. Cash flow from operations was $1.8 billion in fiscal 2018, compared with cash inflow of $2.2 billion in the prior fiscal. At the end of the fiscal, long-term borrowing totaled $27 billion, up from $26 billion at the end of prior fiscal.
Fiscal 2018 Performance
Deere reported adjusted earnings of $9.39 per share in fiscal 2018, falling short of the Zacks Consensus Estimate of $9.51. Including tax adjustments related to the tax reform, the company reported earnings of $7.24 per share in the fiscal, an improvement of 8% year over year.
Net sales of equipment operations improved 29% year over year to $33.3 billion but missed the Zacks Consensus Estimate of $33.4 billion. Total net sales (including financial services and others) came in at $37.4 billion, up 26% year over year.
Fiscal 2019 Outlook
Deere expects equipment sales to rise 7% in fiscal 2019 from fiscal 2018. The Wirtgen acquisition will contribute about 2% to net sales for the fiscal. The forecast factors an unfavorable impact of 2% for foreign-currency translation for fiscal.
For fiscal 2018, Deere anticipates net sales to increase about 7% year over year and projects net income of about $3.6 billion.
Growth in global agricultural and construction equipment markets will drive Deere. The company noted that agricultural equipment is being propelled by replacement demand despite tensions over global trade and other geopolitical issues.
Segment wise, Deere estimates Agriculture and Turf equipment sales to increase about 3% in fiscal 2019 and global sales for Construction & Forestry equipment to rise 15%. The outlook for adjusted net income from Financial Services has been set at $630 million for fiscal 2019.
Share Price Performance
Shares of Deere have lost around 1% over the past year, compared with the industry’s decline of around 4%.
Zacks Rank & Stocks to Consider
Deere currently carries a Zacks Rank #3 (Hold).
Some better-ranked stocks in the same space include Enersys (NYSE:ENS) , Mobile Mini, Inc. (NASDAQ:MINI) and Cintas Corporation (NASDAQ:CTAS) . While Enersys sports a Zacks Rank #1 (Strong Buy), Mobile Mini and Cintas carry a Zacks Rank #2 (Buy). You can see the complete list of today’s Zacks #1 Rank stocks here.
Enersys has a long-term earnings growth rate of 10%. The stock has rallied 21% in a year’s time.
Mobile Mini has a long-term earnings growth rate of 14%. The company’s shares have gained 10% during the past year.
Cintas has a long-term earnings growth rate of 12%. Its shares have gained 21% over the past year.
Looking for Stocks with Skyrocketing Upside?
Zacks has just released a Special Report on the booming investment opportunities of legal marijuana.
Ignited by new referendums and legislation, this industry is expected to blast from an already robust $6.7 billion to $20.2 billion in 2021. Early investors stand to make a killing, but you have to be ready to act and know just where to look.
Mobile Mini, Inc. (MINI): Free Stock Analysis Report
Cintas Corporation (CTAS): Free Stock Analysis Report
Deere & Company (DE): Free Stock Analysis Report
Enersys (ENS): Free Stock Analysis Report
Original post
Zacks Investment Research