
Dogecoin (DOGE) and Basic Attention Token (BAT (LON:BATS)) both appear to be suffering price losses. Can a profitable trade setup be created for either?
In this analysis, we attempt to generate trade setups by comparing the short and medium-term movements of DOGE/BTC and BAT/BTC alongside an assessment of their technical indicators.
Dogecoin (DOGE) vs. Basic Attention Token (BAT): Price Outlook
DOGE reached a high of 110 satoshis on Sep 10, 2018. A gradual decrease followed with a low of 45 satoshis on Nov 14.
An attempted recovery brought DOGE to a high of 83 satoshis on Dec 17. Over the next several months, the price dropped again. Lows below 50 satoshis were reached in March and April. Prices spiked at the end of March and then dropped to under 45 satoshis earlier in May.
This movement caused Dogecoin to breakdown from the horizontal support line traced below:
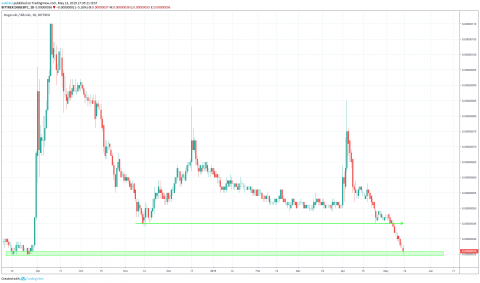
There is a support area near 35 satoshis created from the lows of Aug 2018. At the time of writing, DOGE was trading had dipped into the support area with a wick low of 36 satoshis.
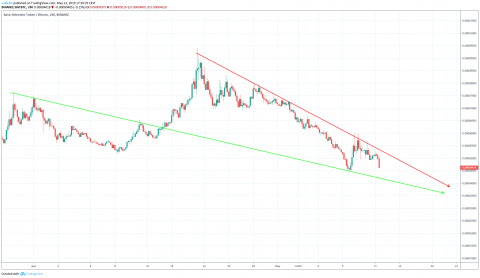
On the other hand, BAT/BTC has been trading along an apparent ascending support line. At the current time, it is trading well above the line. A breakdown does not appear likely.
Price movements are outlined in the graph below:
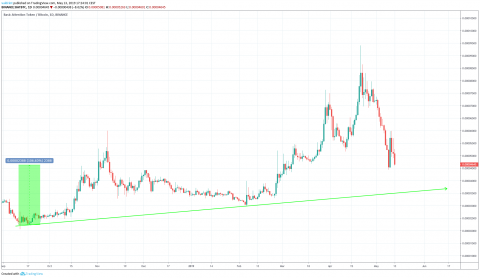
Since the beginning of the support line, the price of BAT has increased by 107%.
Nether BAT nor DOGE appear to have generated a visible resistance line. Thus, no apparent trading pattern can be traced for either.
To better determine future price movements, we examine shorter-term trading patterns for BAT and DOGE alongside technical indicators.
DOGE Trading Inside a Descending Wedge
On Apr 8, the price of DOGE made a low of 52 satoshis. Over the next tend ays, the price gradually rose. A high of 58 satoshis was reached on Apr 18.
Since then, the price has been decreasing inside the descending wedge outlined below:
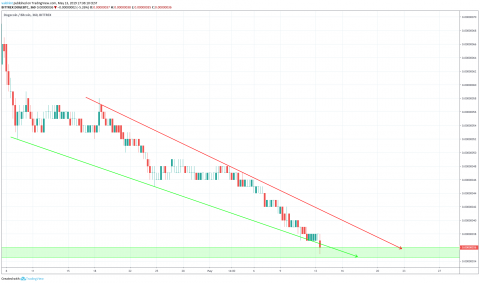
Currently, the price is trading around the support line which has entered into the long-term support area outlined in the first section.
Because the descending wedge is a bullish pattern, a breakout is technically more likely than a breakdown. Before this occurs, the price must make a reversal and reach the resistance line. Furthermore, the wick lows below the support line suggest that a breakdown may occur.
In order to predict whether a breakdown or a reversal is more likely, we will analyze the price of DOGE at 6-hour intervals alongside the RSI below:
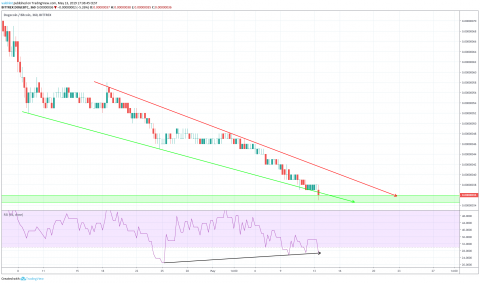
On Apr 25 the price reached a low of 45 satoshis. A decrease ensued and a lower low of 35 satoshis was reached on May 13.
Similarly, the RSI made a low on Apr 25. However, it has continued to generate higher values since.
This is known as bullish divergence and often precedes price increases.
Thus, wick lows below the support line may not catalyze a breakdown. On the contrary, the price may soon make a reversal toward the resistance line.
Long Trade Setup
In last week's analysis of DOGE, we stated:
"We think the prudent move is to wait to see if the price drops towards the support area at 35 satoshis before considering a possible long trade setup."
Because the price has reached the support area, we will consider a long trade setup.
DOGE is currently trading close to the support line of the wedge. Thus, we are going to analyze a possible trade setup with an average entry of 36 satoshis. At the time of writing, the price is trading very close to this level. A stop-loss is placed at 34 satoshis. It is worth noting that the lowest price since Aug 2018 has been 35 satoshis, as outlined in the first section.
This is a stop-loss of 5.7%
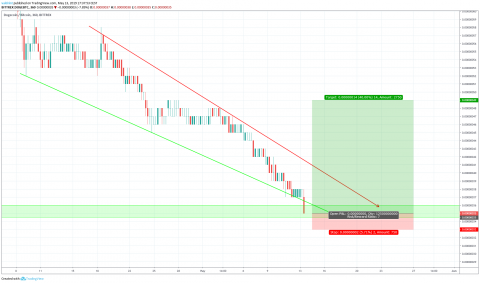
Our first target is set at 49 satoshis, in an area of previous support. A breakout is needed for the price to reach these levels.
According to the indicators, this is likely.
Combined with our stop loss presented earlier, this is a risk-reward ratio of 7.
Now, let's move on to BAT.
BAT Inside a Descending Wedge?
On Apr 16, the price of BAT broke out from a resistance line. That resistance line then became a support line.
A peak of 9400 satoshis was reached on Apr 20. Since that time, BAT has been following a steep resistance line. It dropped from the resistance line and validated the former resistance line as support a on May 8 when the price reached 4500 satoshis.
The support and resistance lines combine to create a descending wedge. While this is outlined in the graph below, it is important to note that the support line may need to be validated at least once more before it can be considered truly valid.
Following May 8's low, a rapid spike brought BAT to validate the resistance line several times. A gradual decrease has been occurring since.
To better assess whether the price will continue to decrease, we will now analyze the price at four-hour intervals alongside the 50-,100-, and 200-period moving averages (MA) below:
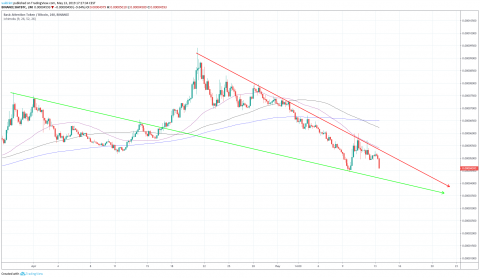
We can see that several bearish crosses have occurred between the aforementioned MAs. Furthermore, the price is trading below all the MAs. and facing very close resistance from the 50-period one.
This indicates that the price likely does not have enough power to move above the resistance.BAT is most likely in a downtrend. If the support line is valid, we might expect the price of BAT to touch the line once more before a reversal toward the resistance line.
Short Trade Setup
Last week, we stated:
"A possible trade setup is analyzed with an average entry of 5750satoshis. The stop-loss is placed well above the resistance line and slightly above the May 6 highs at 6150 satoshis. Our target is set at the support line of the wedge at 3700 satoshis."
Since then, the price has continued to decrease, currently trading at 4600 satoshis. The stop loss can be moved to around 5750 satoshis. This new stop loss would lock in profits close to 3%.
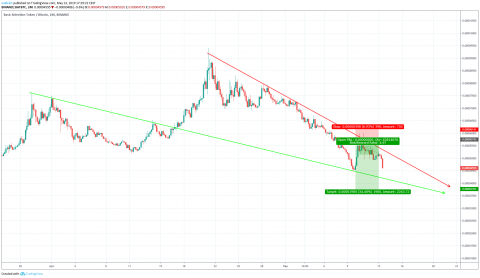
The price has not yet reached our target of 3700 satoshis.nBased on our analysis of technical indicators, it is likely that the price will still eventually reach that area.
Conclusion
To conclude, both DOGE and BAT are currently decreasing.
The price of DOGE is trading inside a descending wedge and has developed significant bullish divergence. Furthermore, it is trading right at the support line which coincides with a major support area from Aug 2018.
Therefore, we have initiated a long trade setup with a very lucrative 7 to 1 risk to reward ratio.
On the other hand, the price of BAT is following a long-term ascending support line. Furthermore, it is also trading inside a short-term descending wedge. The technical indicators paint a bearish picture and support further decreases.
Our previous trade setup has almost reached our target. Furthermore, we have adjusted our stop-loss in order to lock in profit.
To conclude, we believe that the price of DOGE faces a better outlook for the future.
A summary is presented in the table below:

Disclaimer: This article is not trading advice and should not be construed as such. Always consult a trained financial professional before investing in cryptocurrencies, as the market is particularly volatile.