
EUR/USD - European Session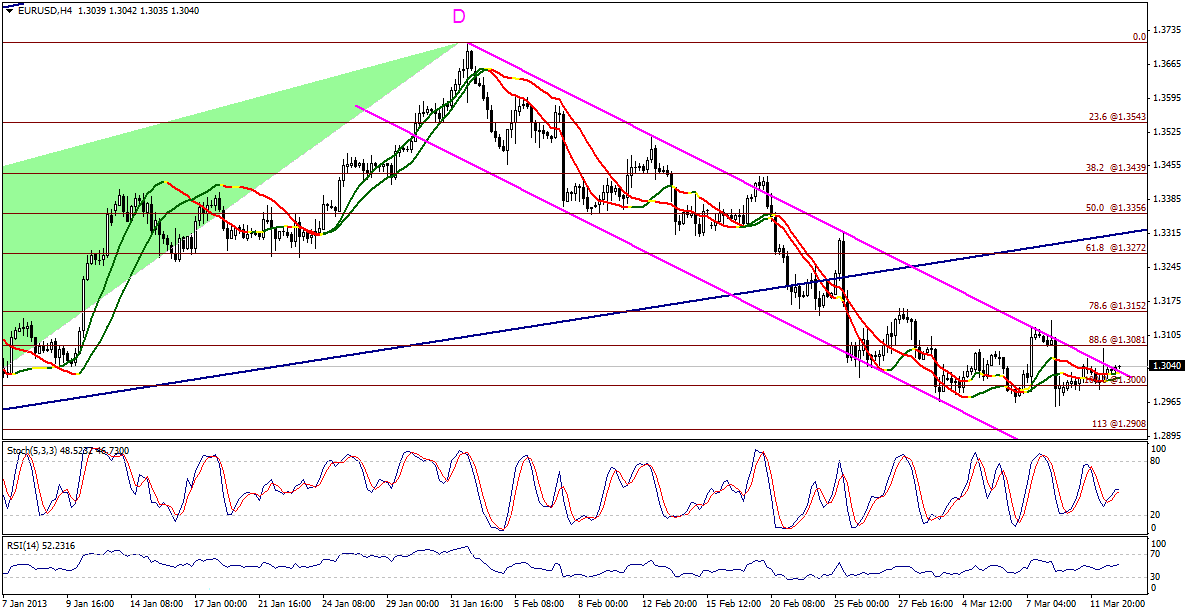 EUR/USD" title="EUR/USD" width="1187" height="612">
The EUR/USD pair moved to the upside, benefiting from stability above 1.3000 levels again. This rise remained limited below 1.3080 levels. Stability below 1.3080 levels keeps the possibility of the downside move valid, but we need confirmation with consolidation below 1.3000 levels, especially that the pair is now trading above Linear Regression Indicators.
The trading range for today is among the key support at 1.2905, and key resistance at 1.3200.
The general trend over short term basis is to the upside targeting 1.4375 as far as areas of 1.2990 remains intact.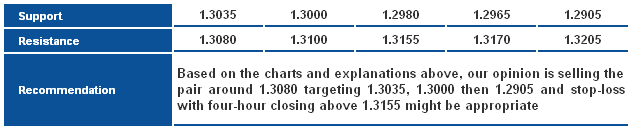 EUR/USD_S&R" title="EUR/USD_S&R" width="633" height="131">
GBP/USD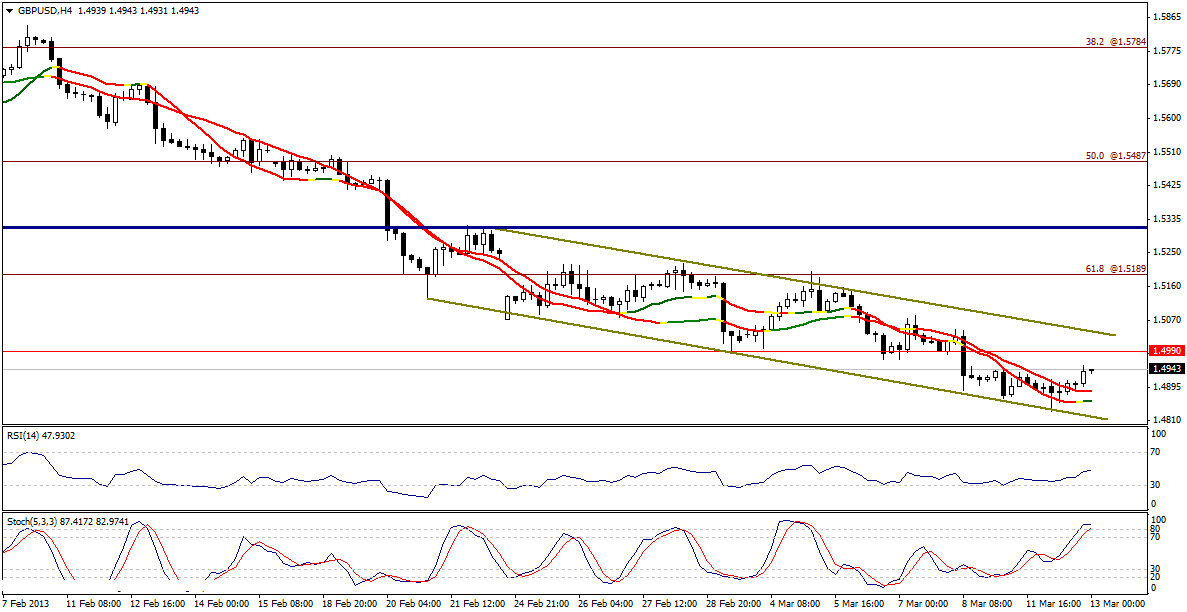 GBP/USD" title="GBP/USD" width="1187" height="612">
The GBP/USD pair rose yesterday, in a correctional move powered by consolidation above key support level of the descending channel. Meanwhile, the pair is still stable below 1.4990 levels and below key resistance of the descending channel. Stochastic offers overbought signals; therefore the possibility of an intraday downside move is valid today as far as areas of 1.5080 hold. We prefer to see the pair stable below 1.5035 levels to further support this outlook.
The trading range for today is among key support at 1.4765 and key resistance at 1.5080.
The general trend over short term basis is to the downside targeting 1.4225 as far as areas of 1.6875 remains intact.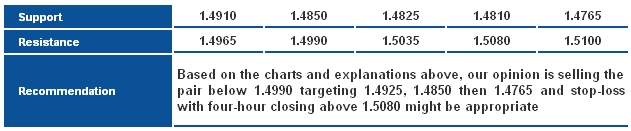 GBP/USD_S&R" title="GBP/USD_S&R" width="631" height="131">
USD/JPY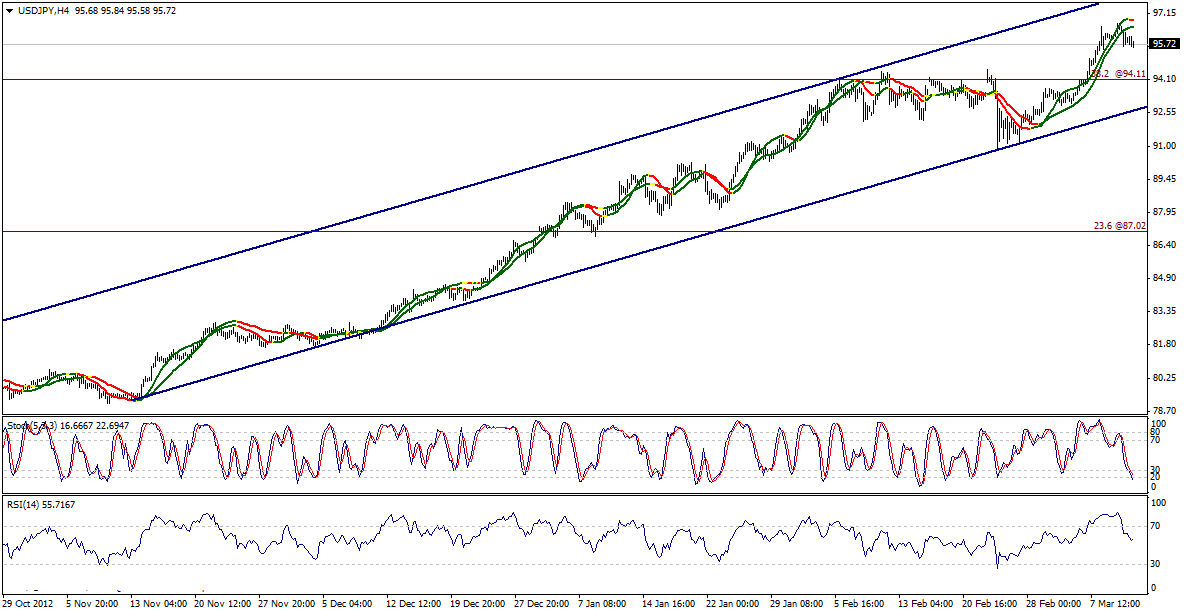 USD/JPY" title="USD/JPY" width="1187" height="612">
The pair is trading with downside bias that pushed Stochastic toward oversold areas on intraday basis. The pair is consolidating above 95.40 levels, supporting the possible return of intraday positivity today. A deeper correction is likely if the pair breaks below the aforementioned 95.40. The ascending channel remains the ideal support to our positive expectations as indicated on the graph.
The trading range for today is among key support at 94.10 and key resistance at 97.10.
The general trend over short term basis is to the upside, targeting 100.00 as far as areas of 84.00 remain intact.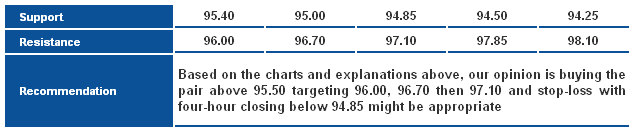 USD/JPY_S&R" title="USD/JPY_S&R" width="632" height="131">
USD/CHF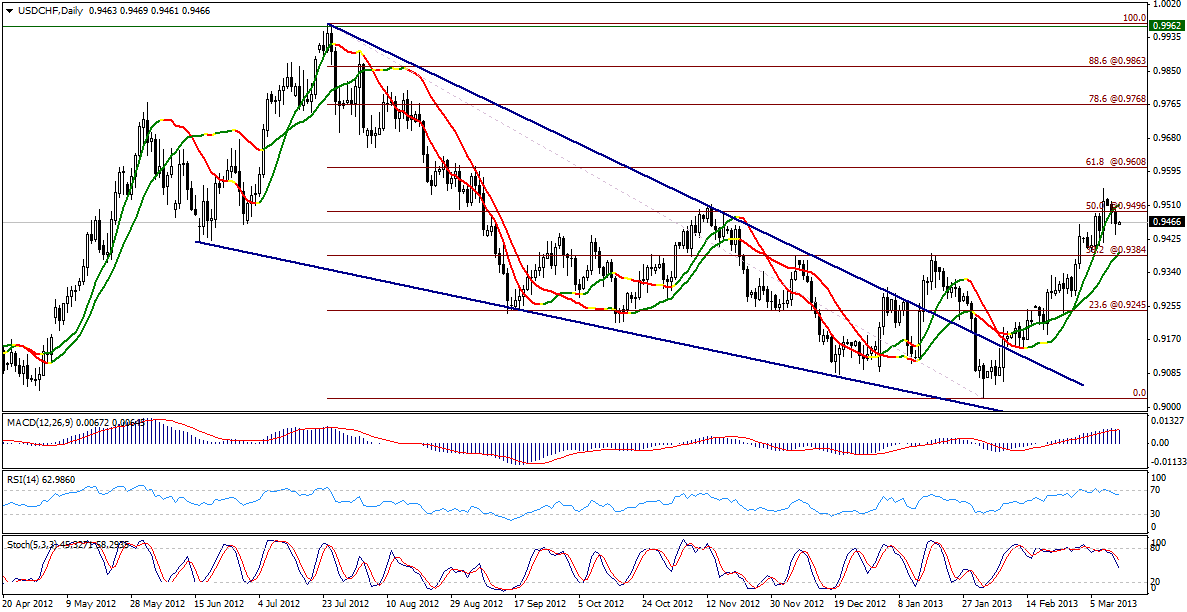 USD/CHF" title="USD/CHF" width="1187" height="612">
The negative bias extended yesterday in response to negativity on momentum indicators, but remained limited above 0.9375 levels that are considered a trend interval. Therefore, we hold on to our positive expectations today, and consolidating above 0.9495 further supports our outlook.
The trading range for today is among key support at 0.9375, and key resistance at 0.9610.
The general trend over short term basis is to the downside stable at levels 0.9775 targeting 0.8860.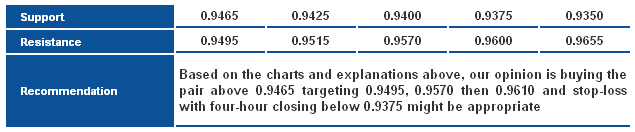 USD/CHF_S&R" title="USD/CHF_S&R" width="635" height="132">
USD/CAD USD/CAD" title="USD/CAD" width="630" height="376">
The negative trading extends affected by the bearish harmonic Bat Pattern, which we think might trigger a bearish correction. Trading below 1.0355 levels will be considered negative over intraday basis, as Relative Strength Index reflects the bearish bias for the pair.
The trading range for today is between the key support at 1.0140, and the key resistance at 1.0445.
The general trend over short term basis is to the upside, with steady daily closing above levels 0.9800 targeting 1.0485.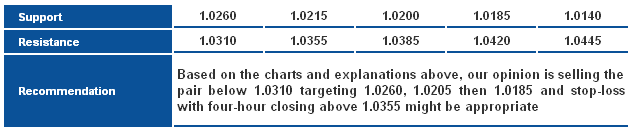 USD/CAD_S&R" title="USD/CAD_S&R" width="633" height="132">
AUD/USD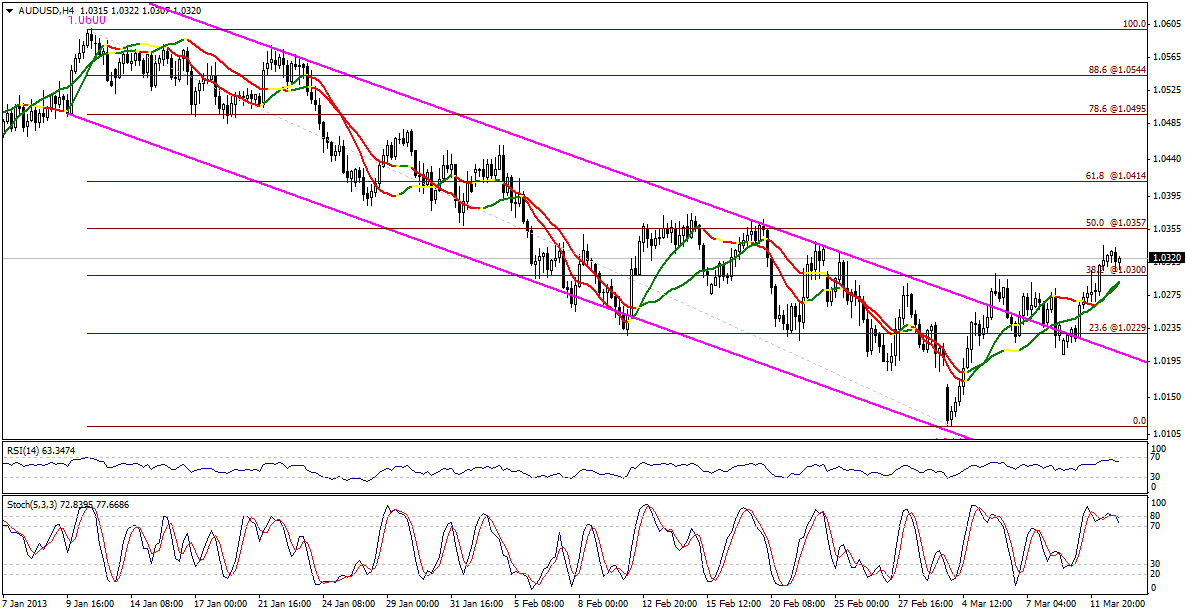 AUD/USD" title="AUD/USD" width="1187" height="612">
The AUD/USD pair stabilized above 1.0300 levels after breaching key resistance of the descending channel which is considered positive and might extend the upside push toward 1.0415 - passing the minor resistance at 1.0355. Linear Regression Indicators support out positive expectations which require stability above 1.0245 to remain valid, a breakout below of which activates negative signals on momentum indicators.
The trading range for today is among key support at 1.0200 and key resistance at 1.0415.
The general trend over short term basis is to the downside, with steady daily closing below levels 1.0710 targeting 0.9400.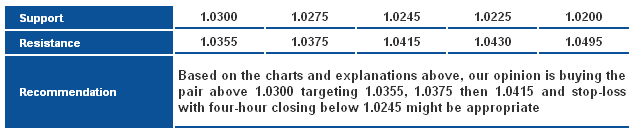 AUD/USD_S&R" title="AUD/USD_S&R" width="633" height="133">
NZD/USD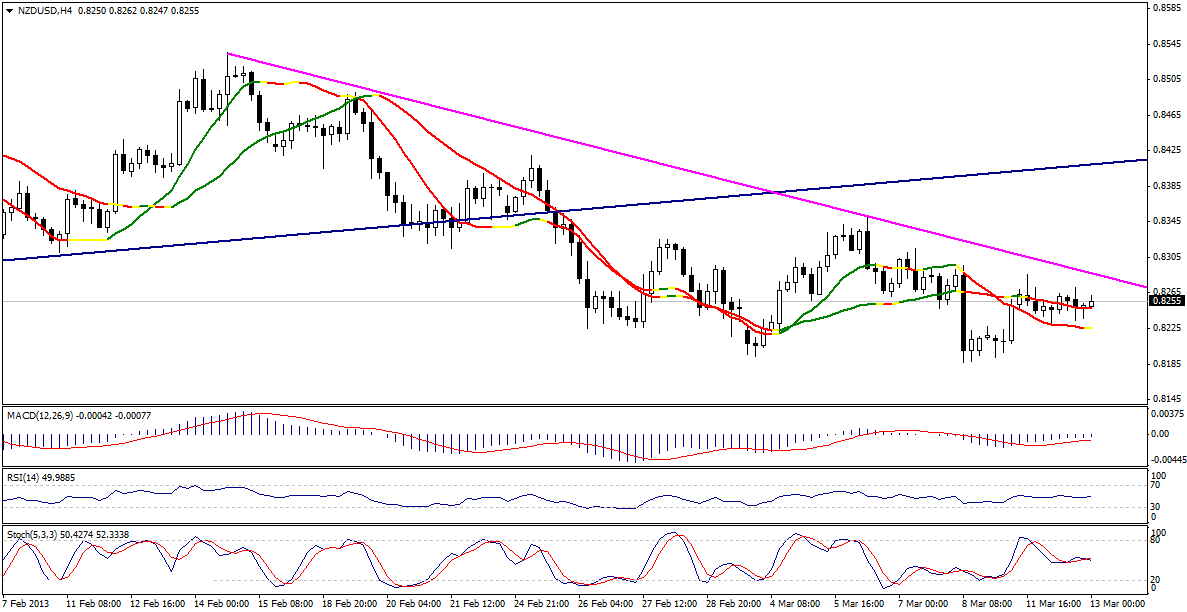 NZD/USD" title="NZD/USD" width="1187" height="612">
By examining the NZD/USD pair’s movement, we find that it’s still stable below key resistance of the downside move indicated on the graph. Meanwhile, the pair is trying to confirm stability above Linear Regression Indicators weakening negativity; these classical mixed signals force us to remain neutral today, especially as trading between 0.8310 and 0.8200 levels carries high risks when there are no other intraday signals supporting the trend.
The trading range for today might be among key support at 0.8160 and key resistance at 0.8355.
The general short-term trend is expected to the upside, with daily closing above 0.8130 targeting 0.8845.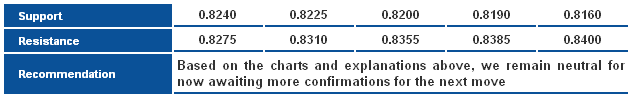 NZD/USD_S&R" title="NZD/USD_S&R" width="632" height="100">
GBP/JPY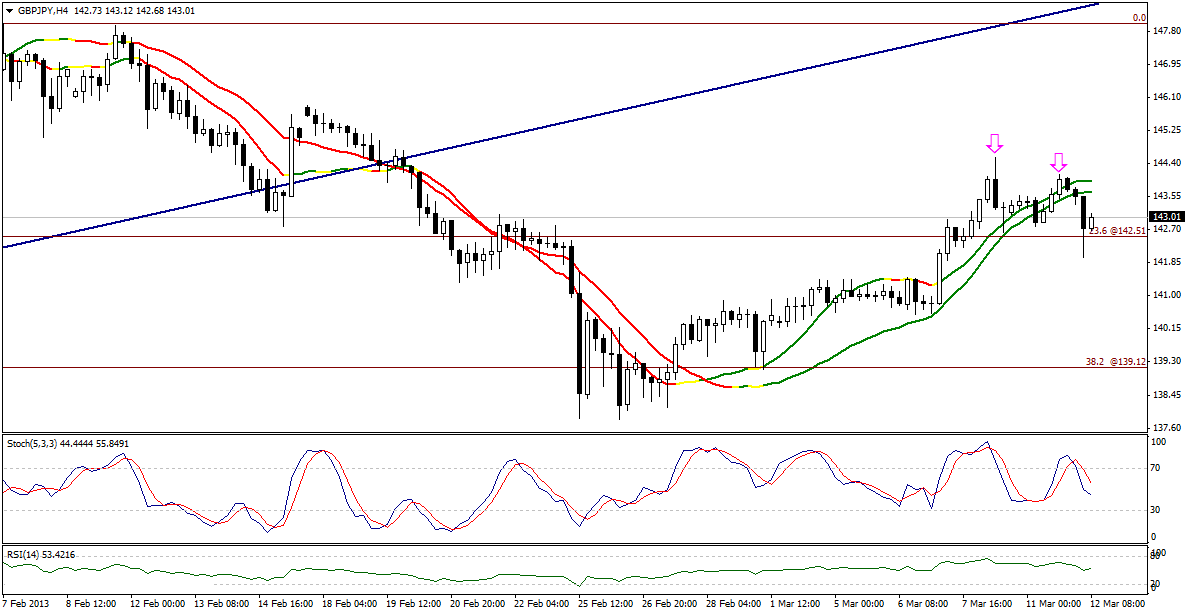 GBP/JPY" title="GBP/JPY" width="1187" height="612">
All of the suggested objectives surrounding 142.00 have been met, as the GBP/JPY pair has rebounded upside. We recommend performing neutrality as a technical contradiction is present, preventing us from expecting a return above 142.50 while settling above LRIs at the same time.
– The trading range expected today is between the key support at 141.10 and the key resistance at 145.80
– The short-term trend is downside targeting 133.60 if 147.80 remains intact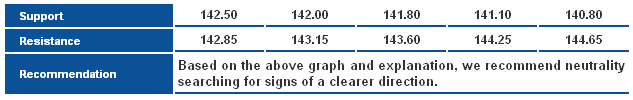 GBP/JPY_S&R" title="GBP/JPY_S&R" width="633" height="100">
EUR/JPY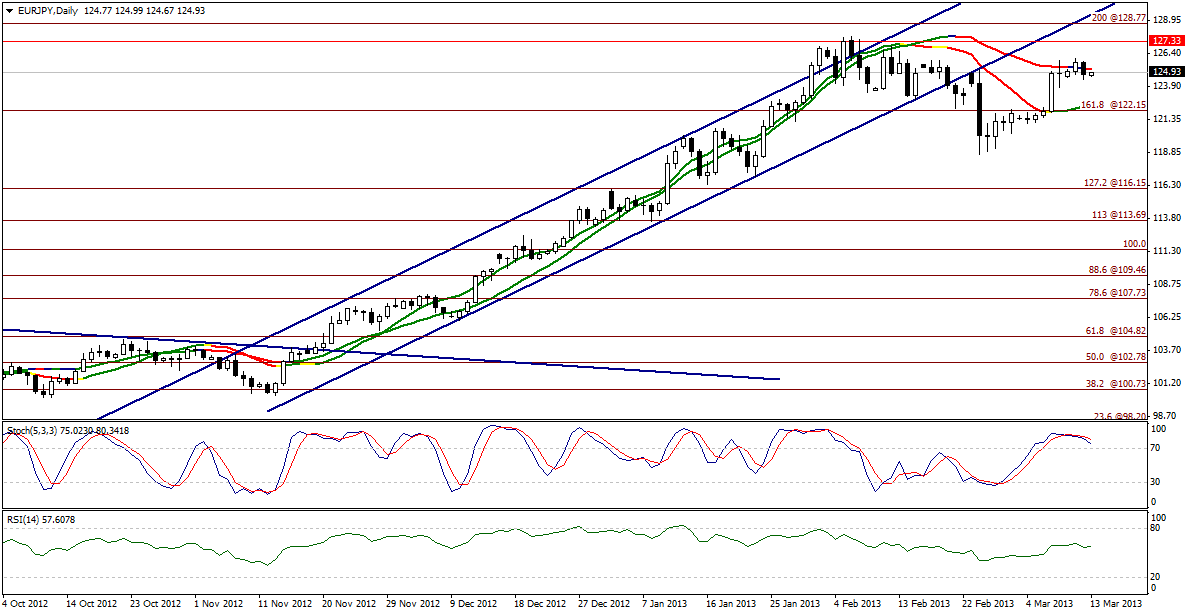 EUR/JPY" title="EUR/JPY" width="1187" height="612">
The EUR/JPY failed to reside above Linear Regression Indicator 55. However, LRI 34 reflects positivity. Stochastic is biased to the downside offering overbought signals. In contrast, the Relative Strength Index is bullish. These technical contradictions render us neutral today until indications of a specific direction emerge, especially as trading is between 127.35 and 122.15.
– The trading range expected today is between the key support at 122.15, and the key resistance at 127.35
– The short-term trend is upside targeting 128.75 if 109.45 remains intact at weekly closing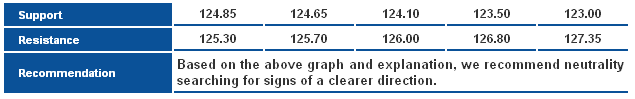 EUR/JPY_S&R" title="EUR/JPY_S&R" width="635" height="99">
EUR/GBP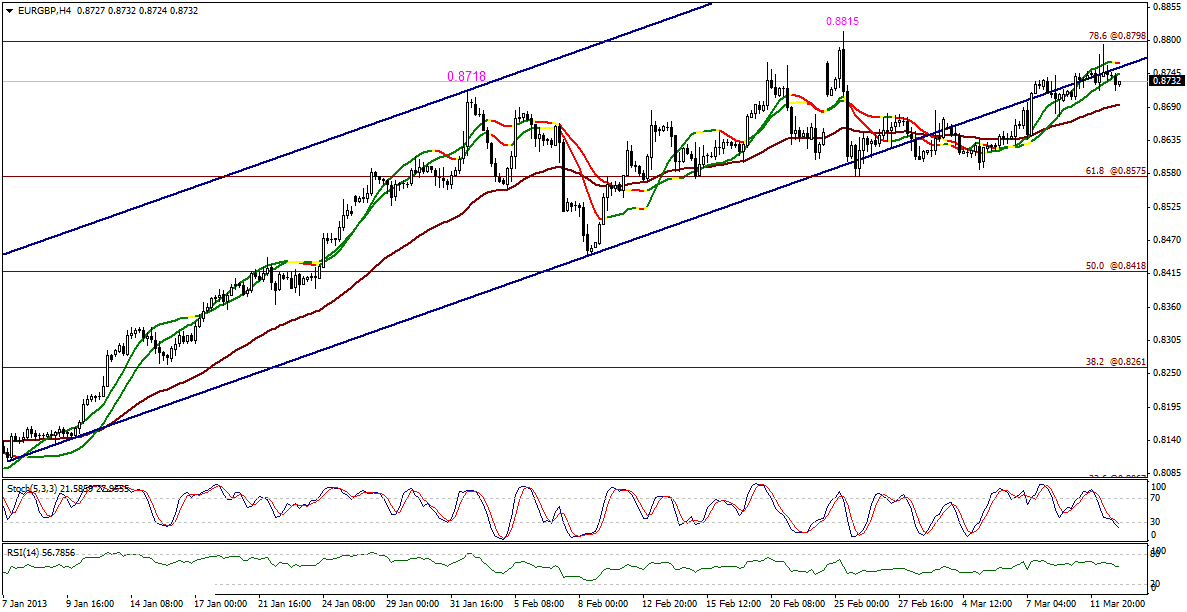 EUR/GBP" title="EUR/GBP" width="1187" height="612">
The EUR/GBP dropped again, trading below the bullish key support after touching level extremely close to the proposed objective 0.8800. The drop carried the pair below Linear Regression Indicators, while the Relative Strength Index is biased lower. We expect the downtrend to extend, depending on capability of breaking and residing below 0.8690.
– The trading range expected today is between the key support at 0.8575 and the key resistance at 0.8800
– The short-term trend is upside targeting 1.0370 if 0.7785 remains intact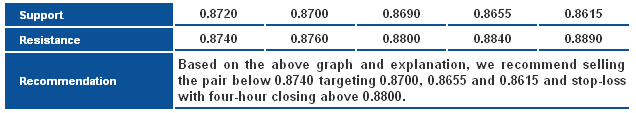 EUR/GBP_S&R" title="EUR/GBP_S&R" width="636" height="113">
- English (UK)
- English (India)
- English (Canada)
- English (Australia)
- English (South Africa)
- English (Philippines)
- English (Nigeria)
- Deutsch
- Español (España)
- Español (México)
- Français
- Italiano
- Nederlands
- Português (Portugal)
- Polski
- Português (Brasil)
- Русский
- Türkçe
- العربية
- Ελληνικά
- Svenska
- Suomi
- עברית
- 日本語
- 한국어
- 简体中文
- 繁體中文
- Bahasa Indonesia
- Bahasa Melayu
- ไทย
- Tiếng Việt
- हिंदी
Daily Technical Report:Major And Cross Currencies - March 13, 2013
Published 03/13/2013, 03:59 AM
Updated 07/09/2023, 06:31 AM
Daily Technical Report:Major And Cross Currencies - March 13, 2013
3rd party Ad. Not an offer or recommendation by Investing.com. See disclosure here or
remove ads
.
Latest comments
Install Our App
Risk Disclosure: Trading in financial instruments and/or cryptocurrencies involves high risks including the risk of losing some, or all, of your investment amount, and may not be suitable for all investors. Prices of cryptocurrencies are extremely volatile and may be affected by external factors such as financial, regulatory or political events. Trading on margin increases the financial risks.
Before deciding to trade in financial instrument or cryptocurrencies you should be fully informed of the risks and costs associated with trading the financial markets, carefully consider your investment objectives, level of experience, and risk appetite, and seek professional advice where needed.
Fusion Media would like to remind you that the data contained in this website is not necessarily real-time nor accurate. The data and prices on the website are not necessarily provided by any market or exchange, but may be provided by market makers, and so prices may not be accurate and may differ from the actual price at any given market, meaning prices are indicative and not appropriate for trading purposes. Fusion Media and any provider of the data contained in this website will not accept liability for any loss or damage as a result of your trading, or your reliance on the information contained within this website.
It is prohibited to use, store, reproduce, display, modify, transmit or distribute the data contained in this website without the explicit prior written permission of Fusion Media and/or the data provider. All intellectual property rights are reserved by the providers and/or the exchange providing the data contained in this website.
Fusion Media may be compensated by the advertisers that appear on the website, based on your interaction with the advertisements or advertisers.
© 2007-2024 - Fusion Media Limited. All Rights Reserved.