
EUR/USD
 EUR/USD" title="EUR/USD" width="600" height="600">
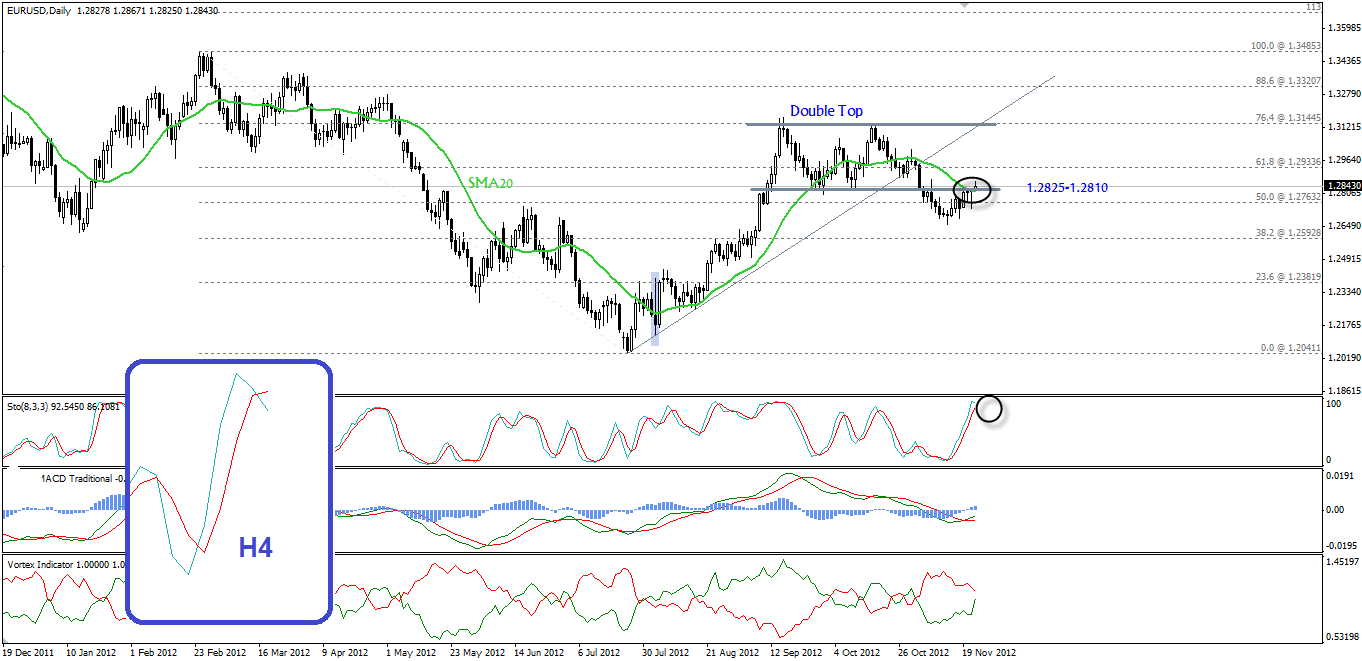
 Yesterday, the pair has recovered again from the support of 1.2730 to achieve a daily closing at 20-Day SMA once again above the weekly Pivotal Point (PP) at 1.2825. We can't join bulls as the pair stabilizes between 50% and 61.8% Fibonacci of the entire downside wave from 1.3485 to 1.2040 while the four-hour interval offers clear overbought condition on Stochastic.
Moreover, the negative effect of the potential double top formation hasn’t been canceled out yet due to the sensitivity of the current trading levels with daily Stochastic approaching overbought regions. Also, we will not be bearish today due to the sharp rebound from 1.2730 zones and thus, staying aside is our today's technical decision.
The trading range for today is among key support at 1.2660 and key resistance at 1.3000.
The general trend over the short-term is to the downside targeting 1.1865 as far as areas of 1.3550 remain intact.  EUR/USD_S&R" title="EUR/USD_S&R" width="684" height="95">
GBP/USD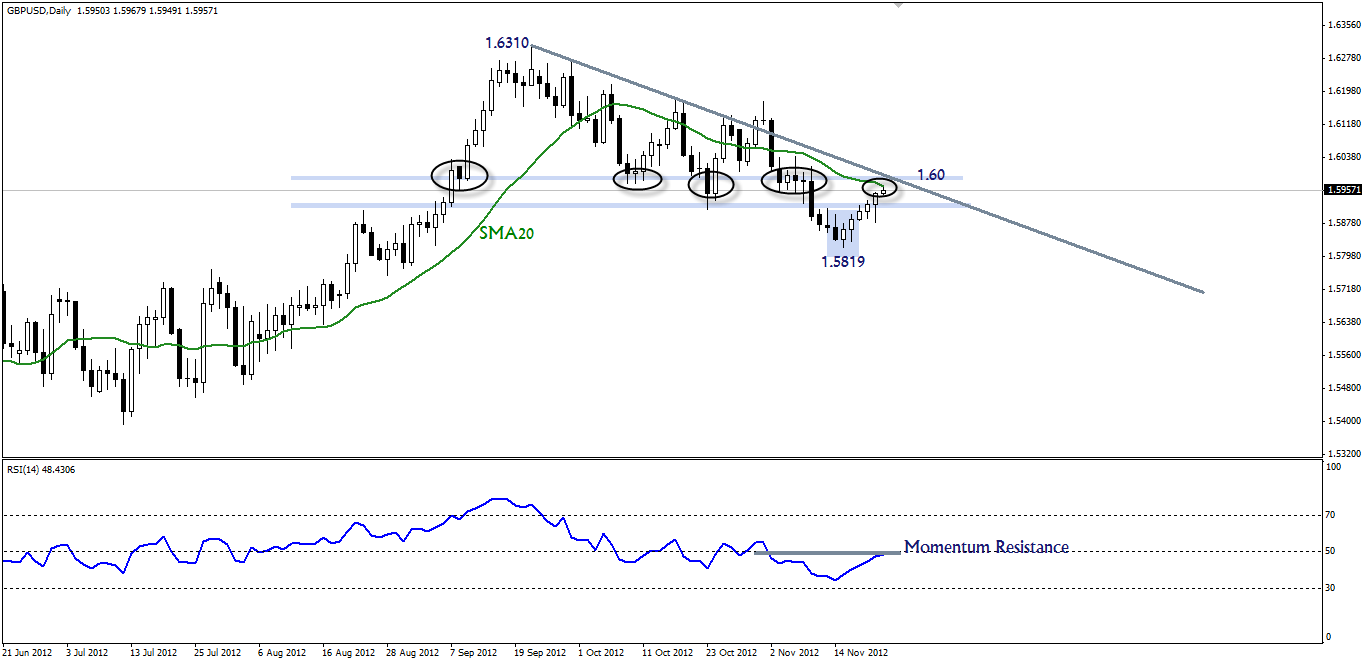 GBP/USD" title="GBP/USD" width="600" height="600">
The pair's consolidation from 1.5820 boundaries is still in progress as the pair succeeded in flirting with the weekly suggested entry point around 1.5960 as seen on the provided daily chart. Actually, we classify the aforesaid consolidation as a corrective process and we hold onto our bearish scenario based on the following technical factors:
- Stability below the falling trend line which connects the movements from the short term peak at 1.6310.
- Experiencing SMA 20 which is a solid resistance.
- Approaching the psychological level of 1.60 which is also a good ceiling for bears.
- RSI 14 is testing a momentum resistance.
On the upside, taking out 1.6050 will shift our stance to neutral while penetrating 1.6165-1.6180 could bring a re-test of 1.6310.
The trading range for today is among key support at 1.5740 and key resistance at 1.6125.
The general trend over the short-term basis is to the downside targeting 1.4225 as far as areas of 1.6875 remain intact. 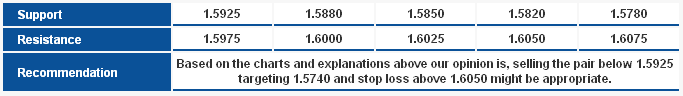 GBP/USD_S&R" title="GBP/USD_S&R" width="683" height="96">
USD/JPY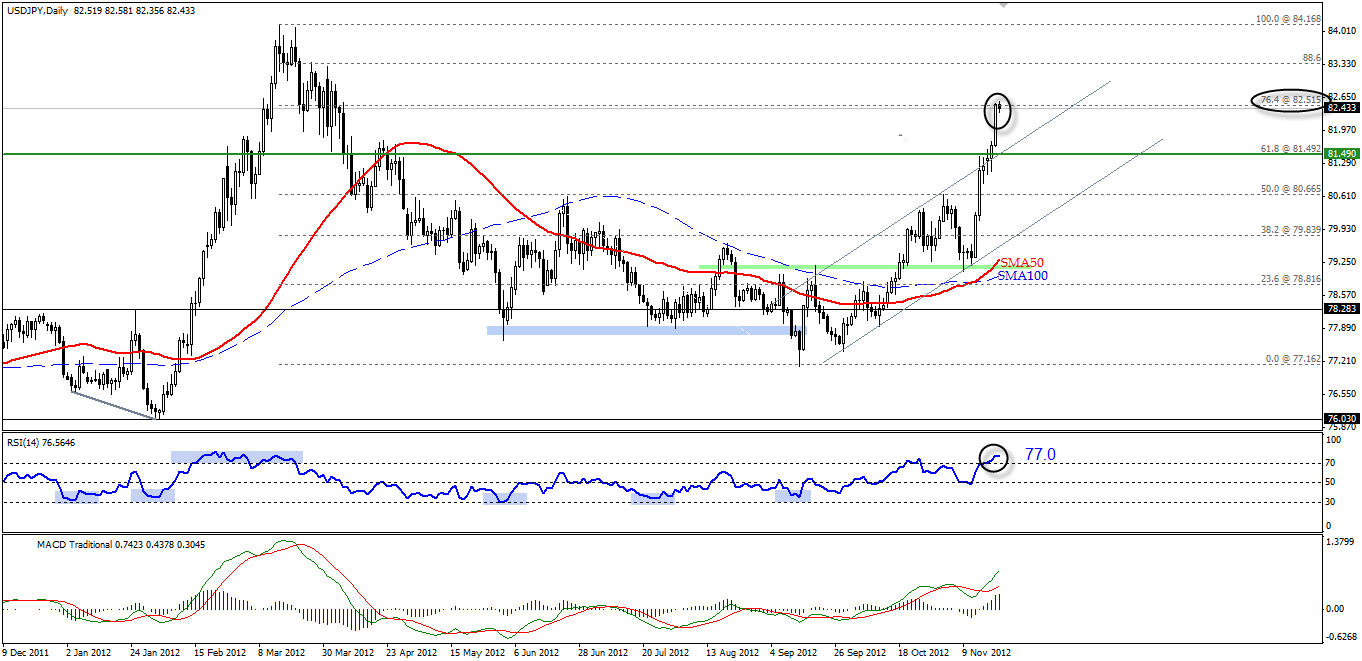 USD/JPY" title="USD/JPY" width="600" height="600">
The USD/JPY pair has set a new peak at 82.58 during the Asian session and that was the highest point in seven months while our extended technical objective of our series of classical analysis was at 82.50. Indeed, the bull trend was strong enough to take the pair towards 76.4% Fibonacci retracement of the downside move from 84.15 to 78.80 which could act as a solid resistance. In the interim, RSI 14 is reflects strong overbought conditions as it is valued at 77.00 and thus, we will use the above technical circumstance to suggest potential downside correction; noting that 83.20 should be our risk limit.
The trading range for today is among key support at 81.50 and key resistance now at 83.65.
The general trend over the short-term basis is to the upside targeting 87.45 as far as areas of 75.20 remain intact.  USD/JPY_S&R" title="USD/JPY_S&R" width="683" height="96">
USD/CHF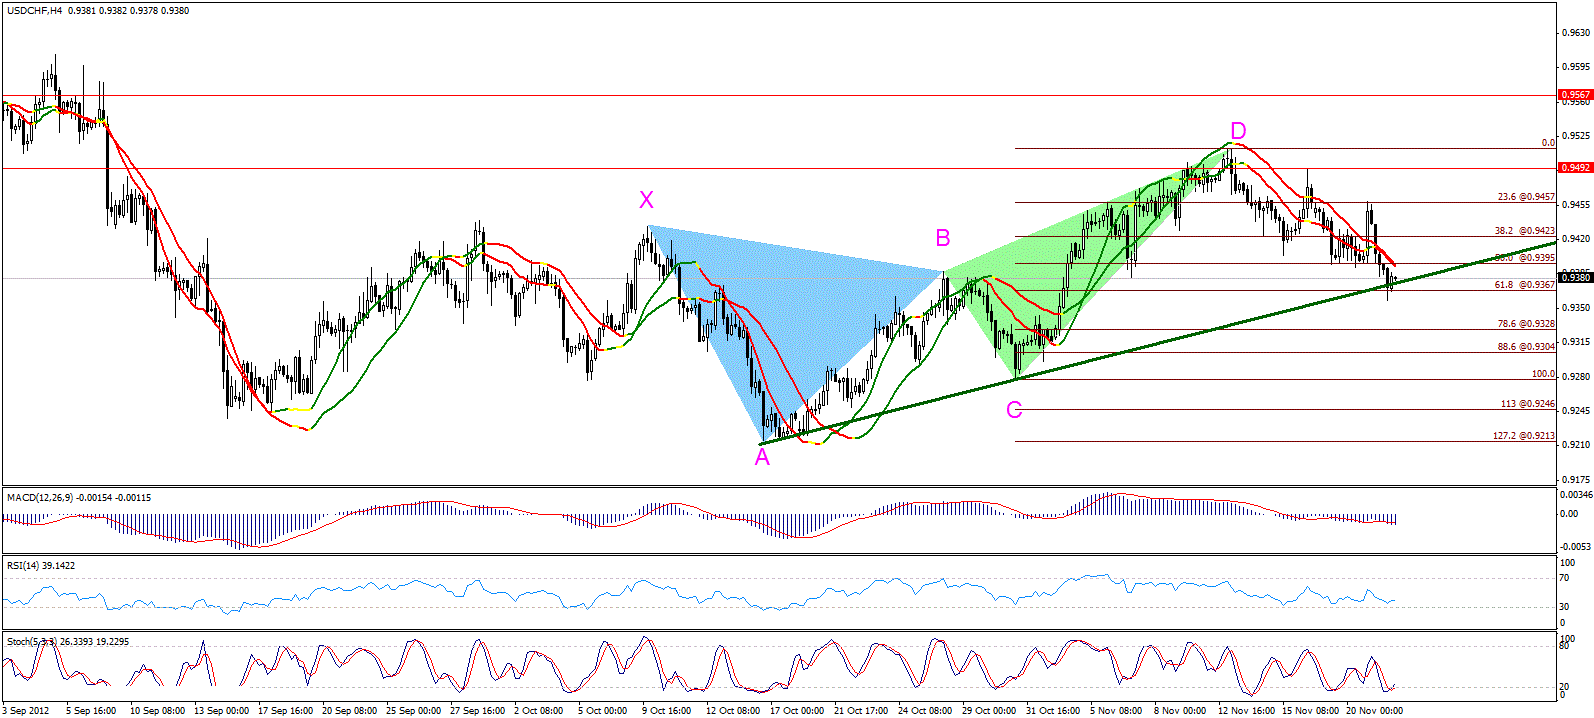 USD/CHF" title="USD/CHF" width="600" height="600">
The pair reached the second target of the bearish Butterfly Pattern -61.8% correction of CD leg- at 0.9365 inline with our expectations. Today, the pair is hovering above the main harmonic resistance connecting A to C and a breach of which is required to extend the downside targets. Stochastic reflects the weakness of the downside move and on the other end we cannot confirm the end of the negativity on the Linear Regression Indicators and accordingly we prefer to stay neutral for now waiting for more confirmations.
The trading range for today is among the key support at 0.9245 and key resistance at 0.9490.
The general trend over the short-term is to the downside targeting 0.8860 as far as areas of 0.9775 remains intact.  USD/CHF_S&R" title="USD/CHF_S&R" width="686" height="96">
USD/CAD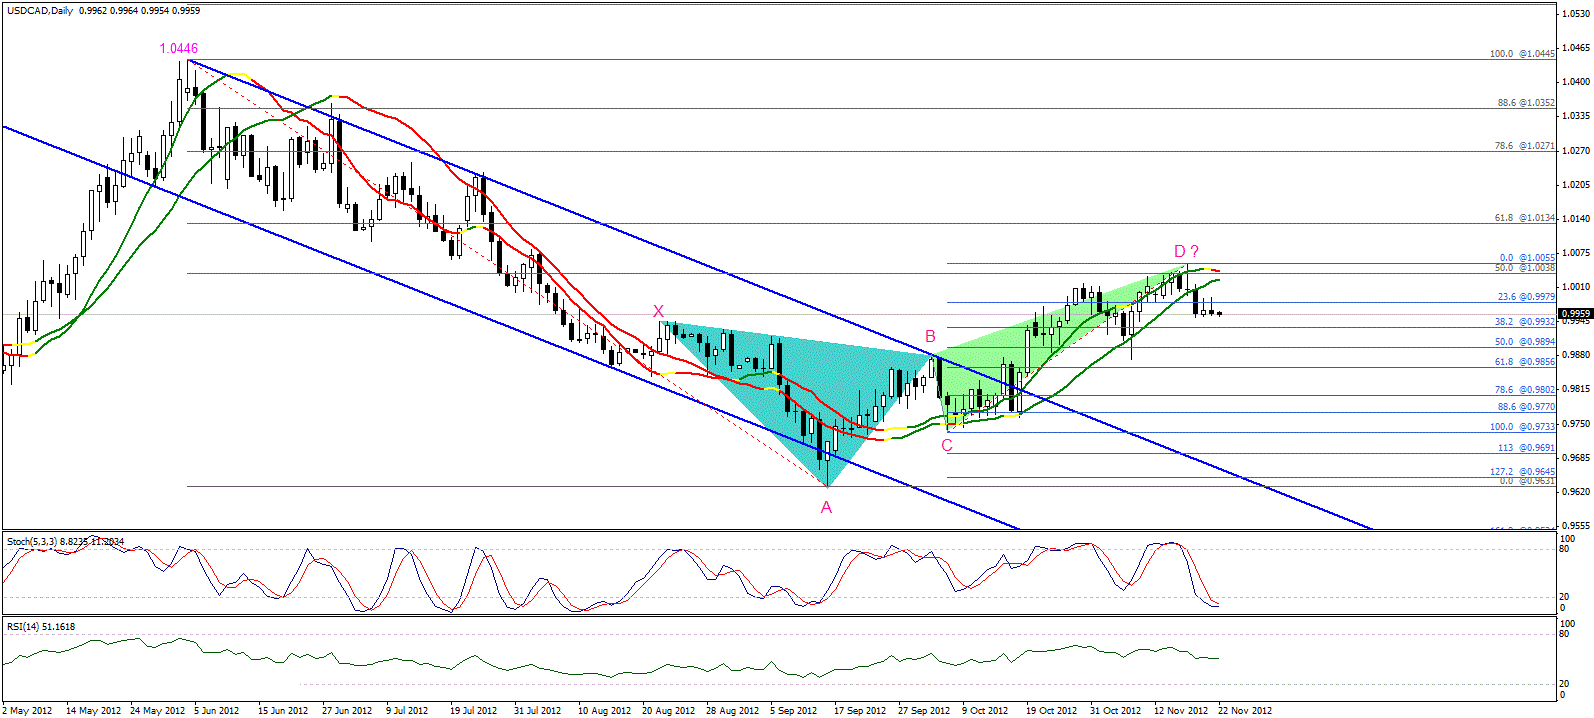 USD/CAD" title="USD/CAD" width="600" height="600">
The negative bias is seen over daily basis; despite the thin trading the Linear Regression Indicator 34 turned negative alongside stability below 23.6% correction on the bearish Butterfly Pattern and we might see the extension of the downside . Stochastic is trading in oversold areas which might limit the downside rush and cause volatility yet trading below 0.9980 keeps the downside move intact. Breaching 1.0040 and stability above it will force us to reconsider the bearish outlook.
The trading range for today is among the key support at 0.9825 and key resistance at 1.0135.
The short-term trend is expected to the downside with daily closing below 1.0125 targeting areas of 0.9400. 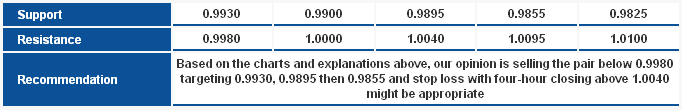 USD/CAD_S&R" title="USD/CAD_S&R" width="682" height="110">
AUD/USD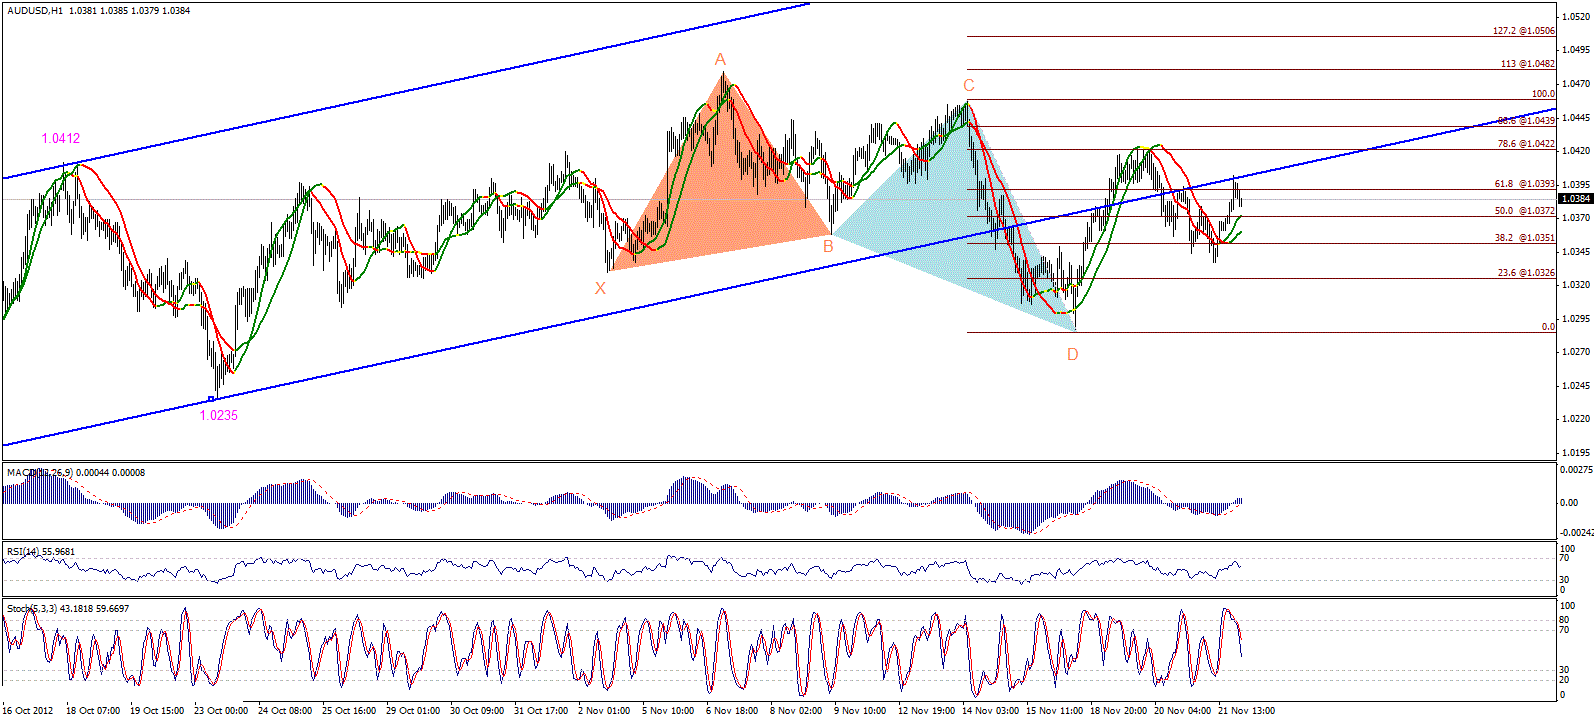 AUD/USD" title="AUD/USD" width="600" height="600">
Over four-hour basis the pair returned toward the second target of the bullish Butterfly Pattern and the bullishness was accompanied by positivity on the Linear Regression Indicators. Trading above 1.0330 will extend the upside move even if the pair hasn’t returned above the ascending support. The Butterfly Pattern supports the upside move and a breach of 1.0420 followed by stability above 1.0440 signals for the extension of the upside move.
The trading range for today is expected among the key support at 1.0300 and resistance at 1.0505.
The short-term trend is to the downside targeting 0.9400 with steady daily closing below 1.0710. 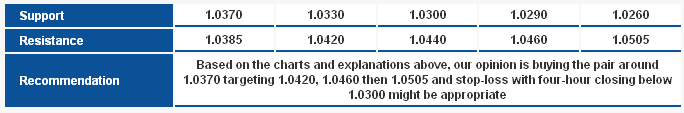 AUD/USD_S&R" title="AUD/USD_S&R" width="684" height="113">
NZD/USD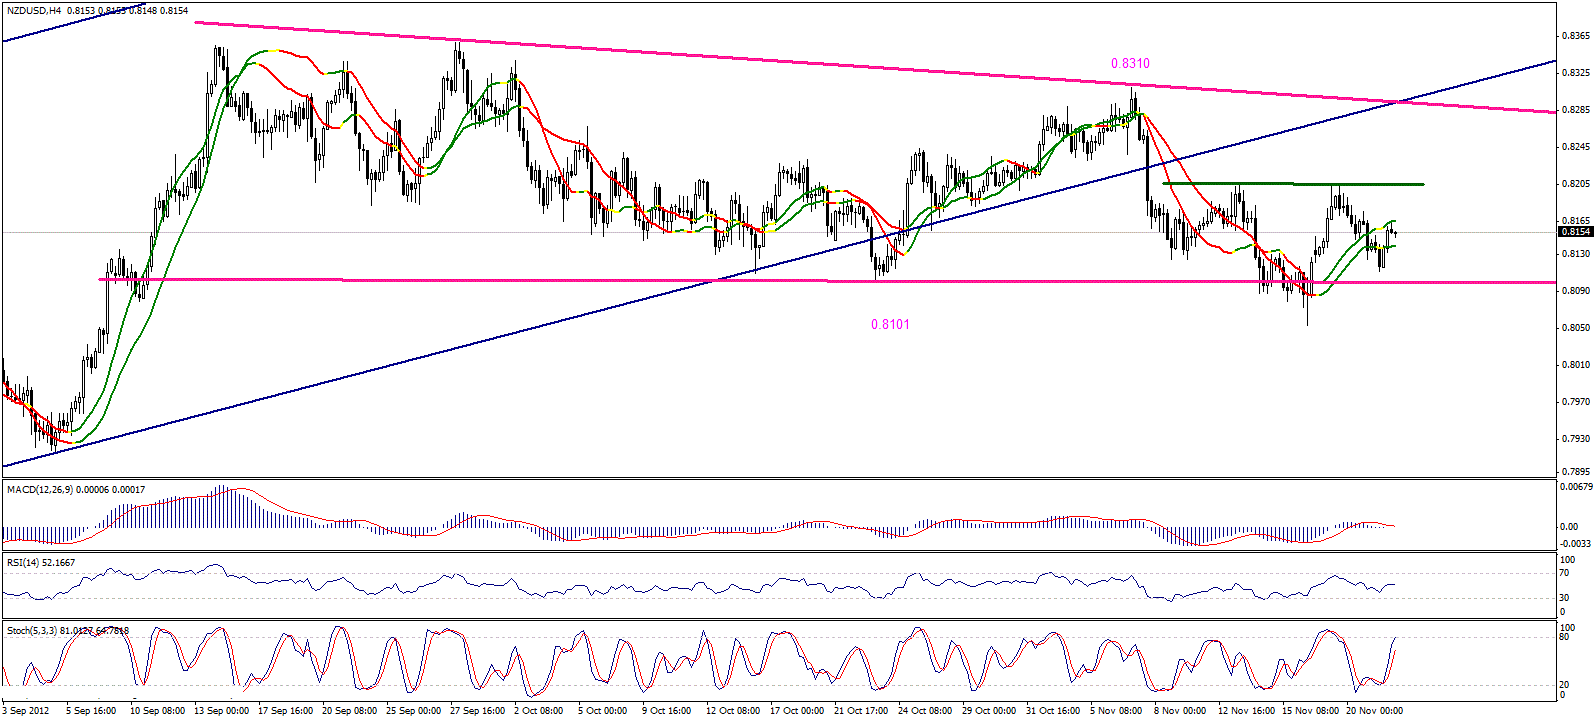 NZD/USD" title="NZD/USD" width="600" height="600">
The Linear Regression Indicator 34 acted as a ceiling for the upside trading, yet we still have the possible formation of the Inverted Head and Shoulders pattern, though we cannot confirm this pattern unless the neckline at 0.8205 is breached. Stability above 0.8100 keeps this possibility valid and trading above this support makes us expect a new upside attempt and breaching 0.8205 will accelerate the bullishness.
The trading range for today is expected among the key support at 0.8080 and resistance at 0.8310.
The short-term trend is to the upside targeting 0.8400 with steady daily closing above 0.7930. 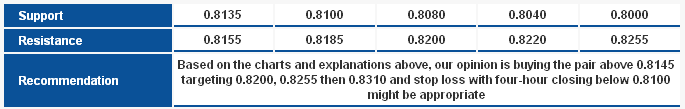 NZD/USD_S&R" title="NZD/USD_S&R" width="685" height="109">
Technical Crosses
GBP/JPY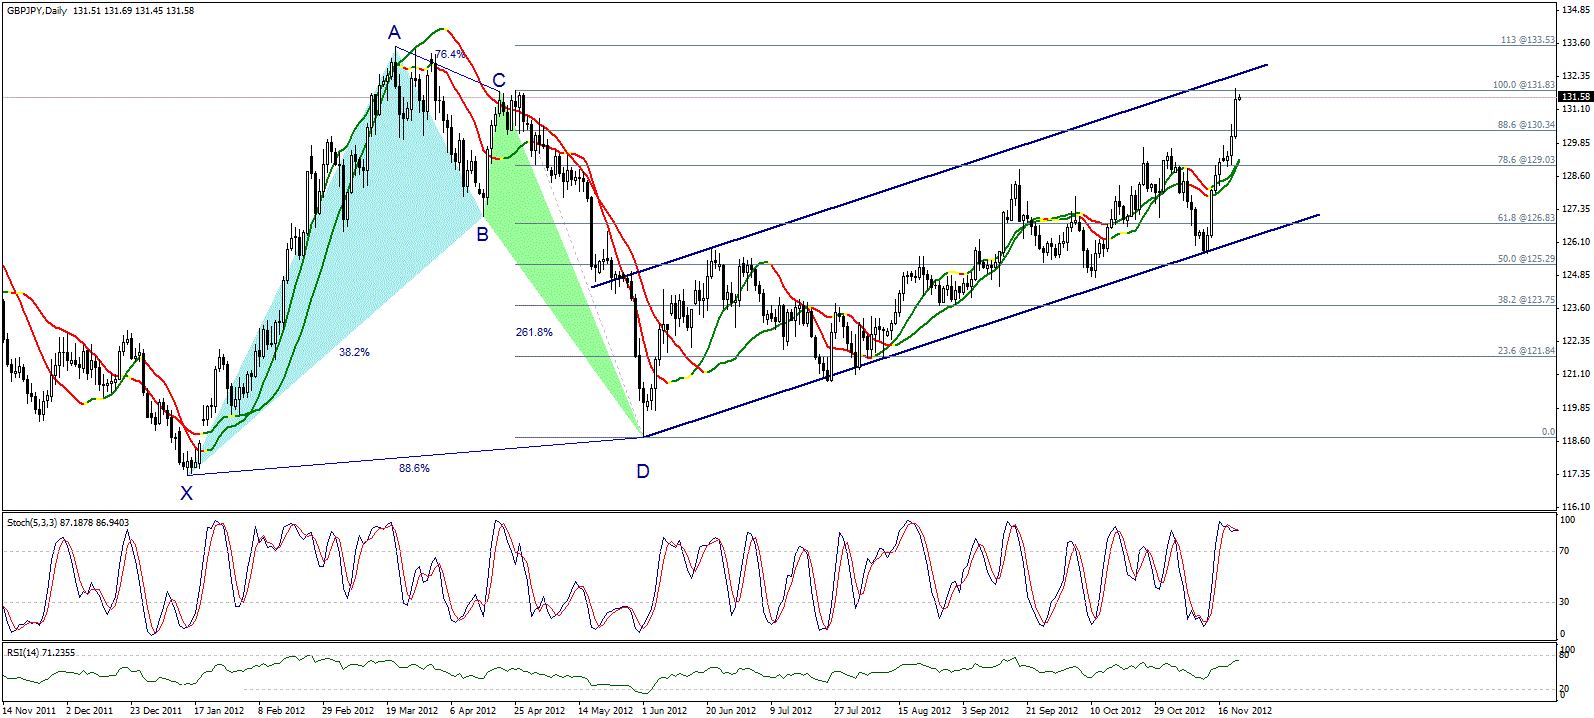 GBP/JPY" title="GBP/JPY" width="600" height="600">
The pair reached the 131.85 level we expected in our last report, representing the "C" top near the main resistance of the bullish wave as shown on the chart. Stochastic enters overbought areas, which could slow the bullishness, perhaps even enter a bearish correction. Nonetheless, we cannot favor negativity at this point because the pair is still under the influence of the bullish Bat pattern. Therefore, we remain neutral and observe how the pair behaves at the mentioned 131.85 level.
The trading range expected for today is between the key support at 129.05 and the key resistance at 133.55 .
The short-term trend is to the downside targeting 112.00 as far as 150.00 remains intact. 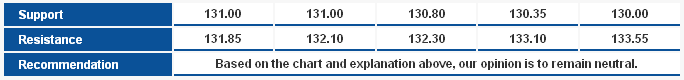 GBP/JPY_S&R" title="GBP/JPY_S&R" width="684" height="80">
EUR/JPY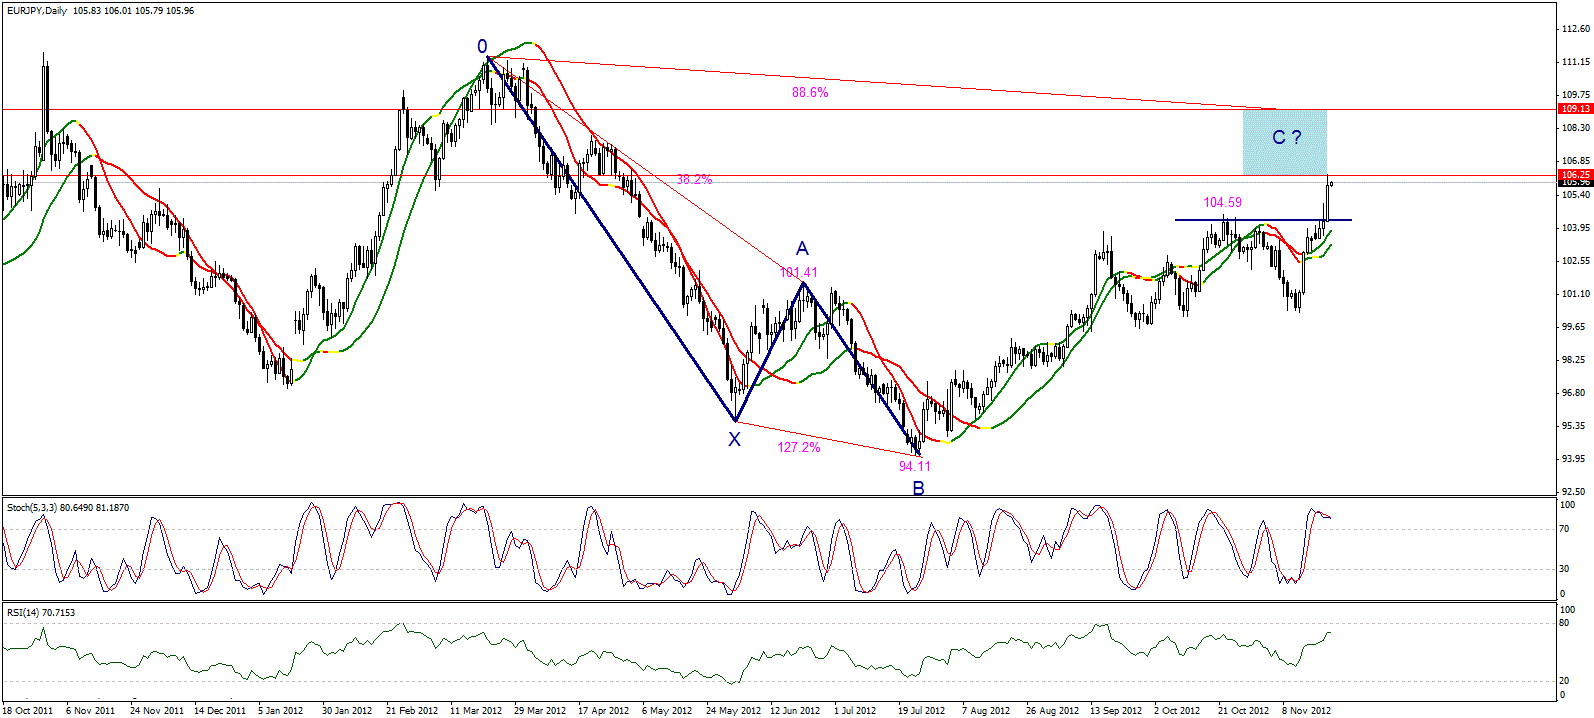 EUR/JPY" title="EUR/JPY" width="600" height="600">
The pair rose to 106.25 we expected from extremely low levels, and at those levels the pair completes the BC leg of the Harmonic 0-5 pattern that extends till 109.10, which is suitable to form the BC leg. The level 109.10 is also the finish point of the bearish Harmonic Shark pattern setup. So far, none of the mentioned harmonic patterns have been confirmed and the Fibonacci rhythmic suggest either one of these patterns.
Hereon, we are at extremely critical levels and observed over intraday basis; currently, since the pair is close to 106.25 and all of our targets have been achieved, we remain neutral in this report and observe trading over intraday basis for more confirmations.
The trading range expected today is between the key support at 102.60 and the key resistance 106.25
The short-term trend is to the upside targeting 109.15 as far as 98.75 remains intact at week`s closing.  EUR/JPY_S&R" title="EUR/JPY_S&R" width="687" height="77">
EUR/GBP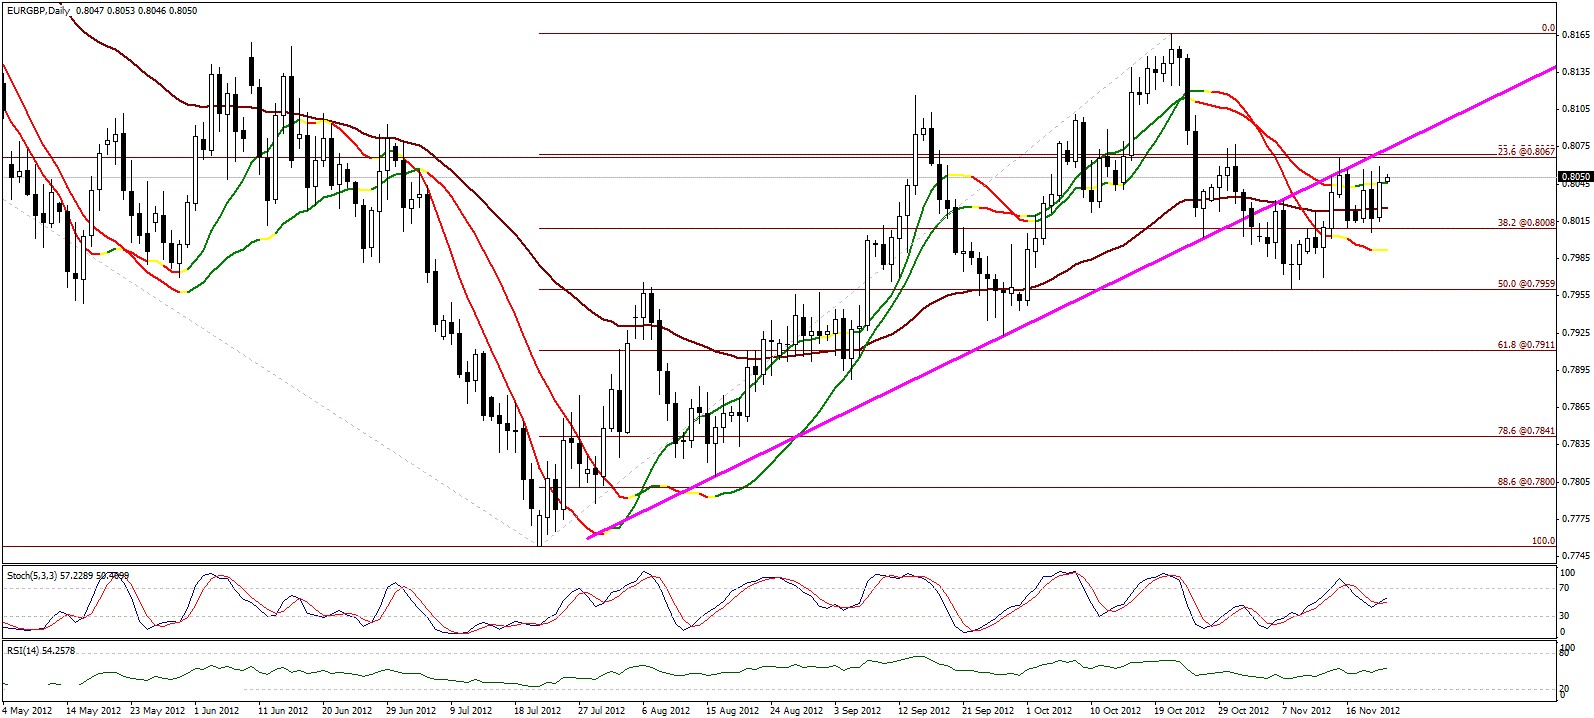 EUR/GBP" title="EUR/GBP" width="600" height="600">
The pair rose again after failing to breach 0.8000 and trade back above 0.8030. However, bullishness remains limited below 0.8070. According to classic technical analysis, stability below the main ascending support breached earlier compels us to stay aside, where we accept the return-risk ratio; breaching the 0.8070 level will create an Inverted Head and Shoulders pattern that will push the pair to the upside. Considering the previous facts, our opinion is to sell the pair among these levels and limit risk above 0.8070, and vice versa if the pair stabilizes above that level.
The trading range expected for this week is between the key support at 0.7925 and the key resistance 0.8165.
The short-term trend is to the upside targeting 1.0370 as far as 0.7785 remains intact .  EUR/GBP_S&R" title="EUR/GBP_S&R" width="681" height="127">