
The Secular Market Cycle
A secular bull market is defined as a period in which stock prices rise at an above-average rate for an extended period (think five years or longer) and suffer only relatively short intervening declines.
A secular bear market is an extended period of flat or declining stock prices. Secular bull or bear markets typically consist of multiple cyclical bull and bear markets. 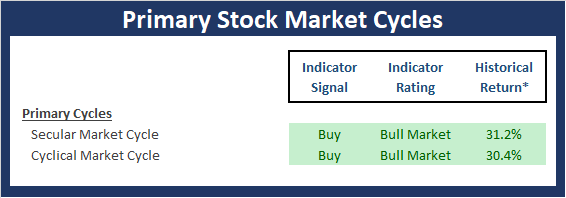
Source: Ned Davis Research (NDR) as of the date of publication. Historical returns are hypothetical average annual performances calculated by NDR. Past performances do not guarantee future results or profitability.
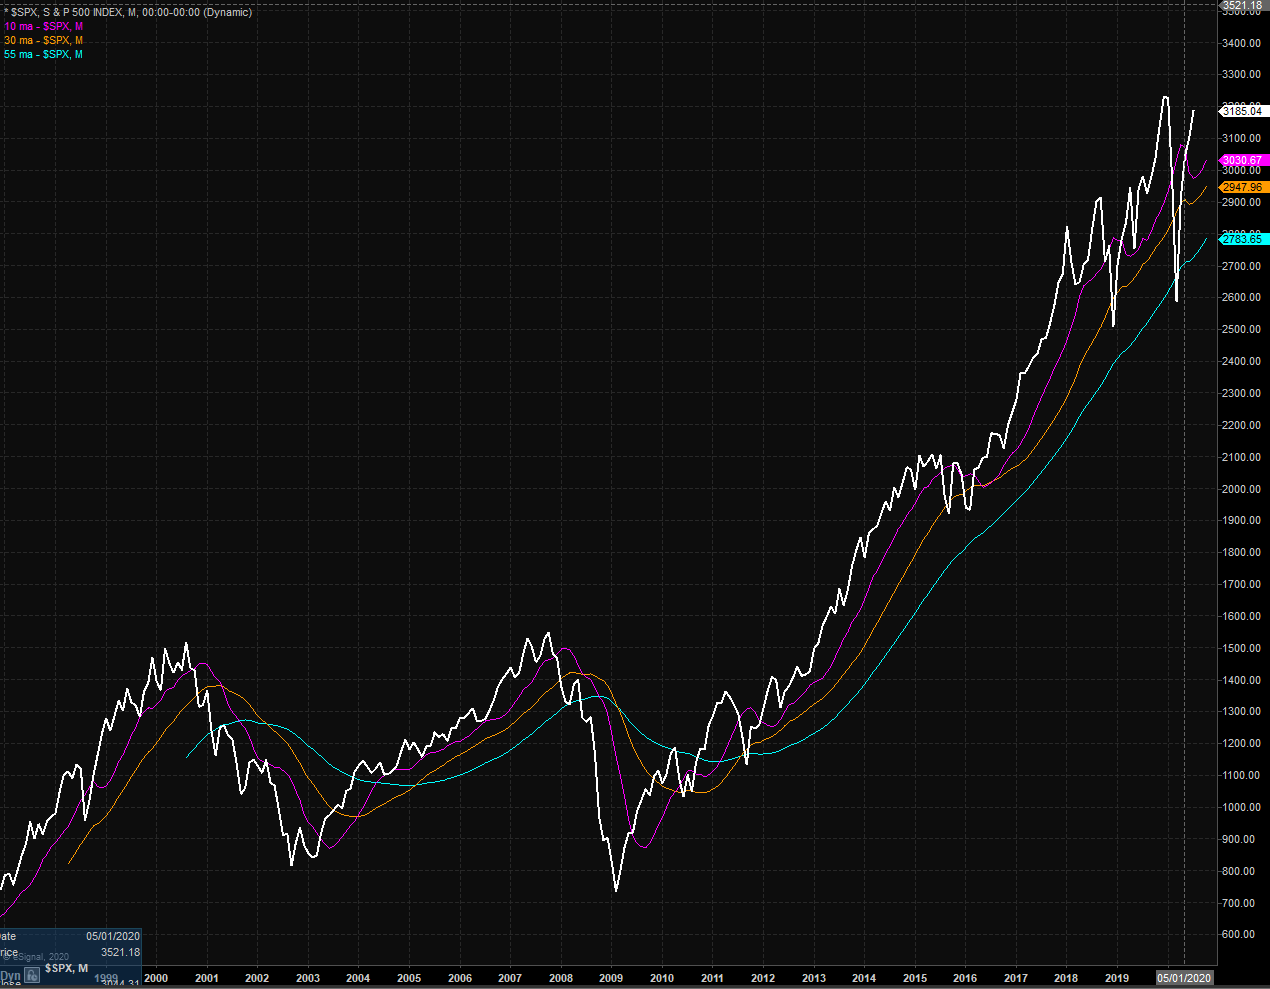
Below is a monthly chart of the S&P 500 Index illustrating the current cycle, which we estimate began on March 9, 2009.
S&P 500 - Monthly
The Cyclical Market Cycle
A cyclical bull market requires a 30% rise in the DJIA after 50 calendar days or a 13% rise after 155 calendar days. Reversals of 30% in the Value Line Geometric Index since 1965 also qualify.
A cyclical bear market requires a 30% drop in the DJIA after 50 calendar days or a 13% decline after 145 calendar days. Reversals of 30% in the Value Line Geometric Index also qualify.
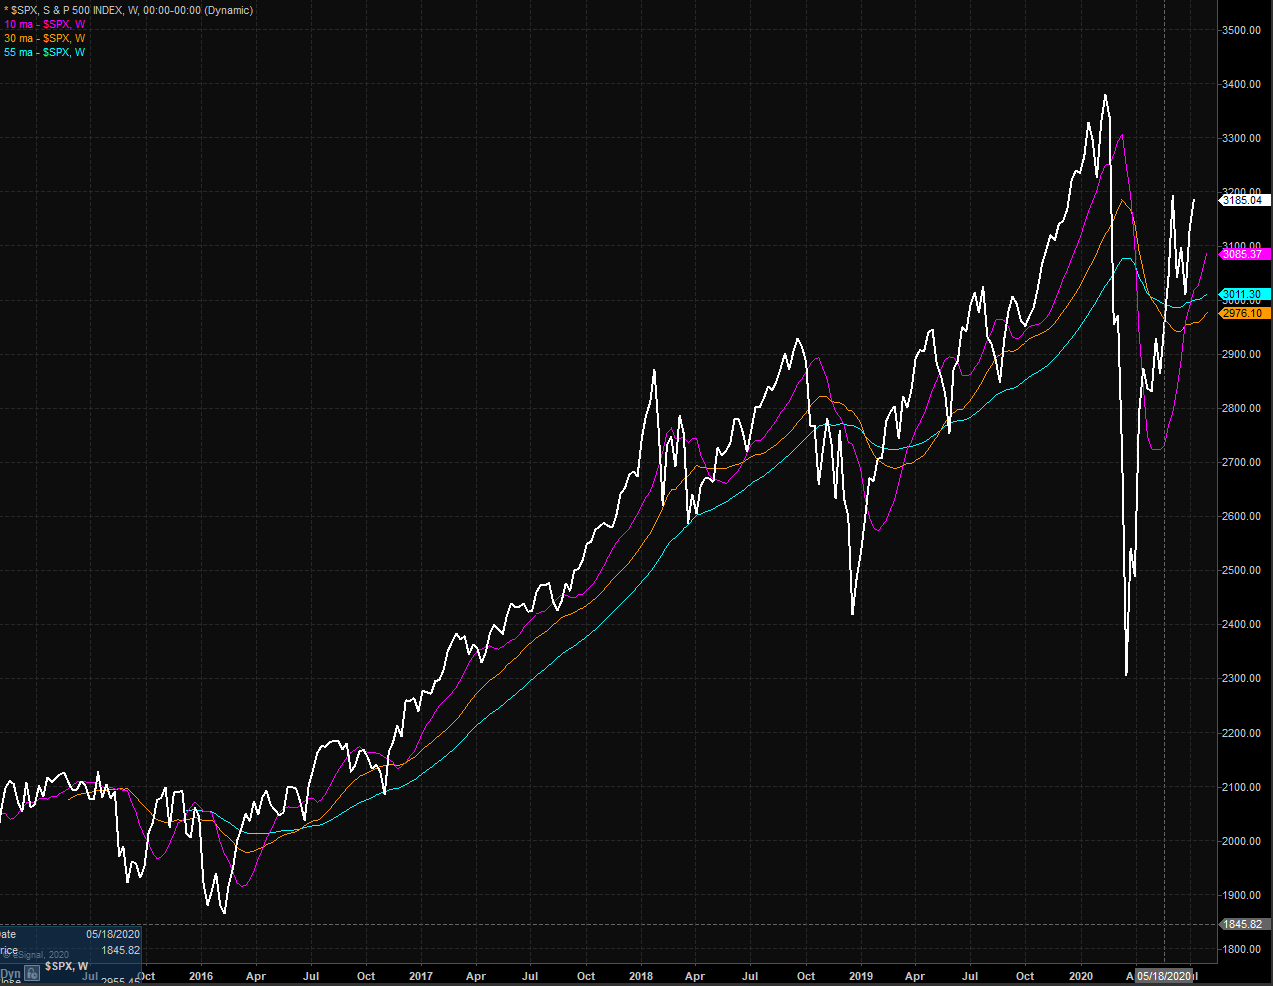
Below is a weekly chart of the S&P 500 illustrating the current cycle, which we estimate began on March 24, 2020.
S&P 500 - Weekly
Current State of Primary Cycle Market Models
We have hand selected each model for this board and have utilized several of the models in our daily work for decades. Each of the models on the board is designed to provide a standalone reading of market health, and each has a strong historical record of staying on the proper side of the market's primary trend. Taken together, the Primary Cycle Model board is intended to help determine the overall "state of the
market."
There are no changes to report on the Primary Cycle board once again this week. However, it is worth noting that our Leading Indicators Model is teetering. This model is a series of 10 indicators that have historically shown tendencies to lead the market at major turning points. The good news is the current "signal" from the model is "buy." The bad news is the current reading is very close to turning negative. This
doesn't mean it will slip into the red, but since this model has been known to provide timely sell signals, it is something I am watching closely. Overall, I continue to believe the Primary Cycle board supports the idea that stocks are currently in the midst of a cyclical bull market and suggests that the bulls should be given the benefit of any doubt.
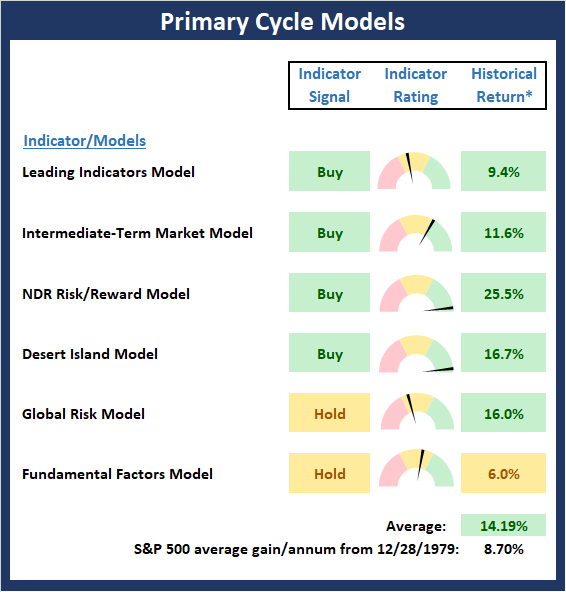
* Source: Ned Davis Research (NDR) as of the date of publication. Historical returns are hypothetical average annual performances calculated by NDR. Past performances do not guarantee future results or profitability.
Thought For The Day: Feed yourself positive thoughts; you can do positive things. Feed yourself negative thoughts; you do negative things.
– Dr. Robert Schuller