Crude Searches For Direction As News Flow Slows
Crude Oil could consolidate over the session ahead as traders look past further reports of unrest in OPEC members. Similarly, gold may be afforded some breathing room if upcoming US services activity data fails to yield a recovery for the greenback.
Crude oil is treading water during the Asian session thus far with the fresh oil-impacting news flow seemingly limited. The latest reports of turmoil in Northern Iraq at this stage hold little potential to meaningfully impact prices. This is likely to remain the case unless there is a material escalation of the conflict that threatens to disrupt production in the south.
Similarly, the probability of supply disruptions from Russia, the world’s largest energy exporter, remains low. The latest round of sanctions from the West have spared the country’s oil exports. It seems an unlikely proposition at this point that Europe would cut off its primary supplier of energy.
This leaves traders to await Wednesday’s US inventories data. Recent reports have raised concerns about an oversupply in gasoline stockpiles – suggesting soft demand for the commodity. If this trend continues it could put further pressure on WTI.

Gold Faces Conflicting Cues As Geopolitical Concerns Fade
Also on the geopolitical front; the announcement of a ceasefire between Israel and Palestine may have calmed investors’ nerves. Ebbing tensions in the region may sap some of the associated safe-haven demand for the precious metals (although the degree of support offered in the first place seemed to have been limited).
While fading turmoil in Eastern Europe and the Middle East puts gold in a precarious position, the yellow may be afforded some breathing room from a sustained US Dollar slump. The greenback has struggled to sustain last week’s rally with US 10 year yields drifting back below 2.5 percent this week.
Upcoming US ISM Non-Manufacturing figures comprise the only piece of ‘top-tier’ US economic data on the calendar over the session ahead. The gauge of services sector strength is tipped to climb to its highest level in 11 months. However, the potential for the leading indicator to inspire a recovery for the USD is questionable, based on its limited impact on Fed policy bets at this point. An unimpressed US Dollar is likely to ease some of the pressure on the gold price.
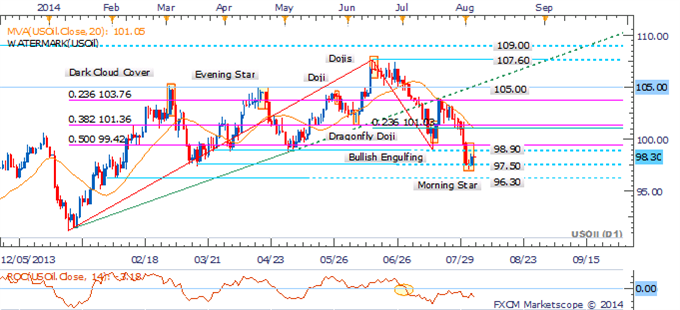
Crude Oil: Corrective Bounce Offers New Short Entries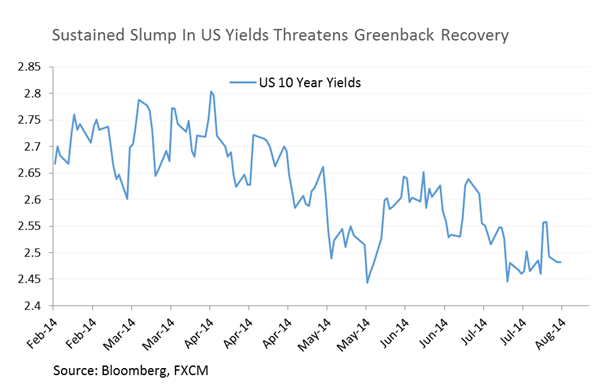
Crude Oil: Corrective Bounce Offers New Short Entries
Downside risks remain for crude given the short-term downtrend remains in force (signaled by the 20 SMA). The corrective bounce to 98.90 is seen as a new opportunity to look at short positions, with a target offered by the 97.50 floor. A Morning Star formation suggests some caution may be warranted, however the bullish pattern lacks confirmation from a successive up-period at this stage.
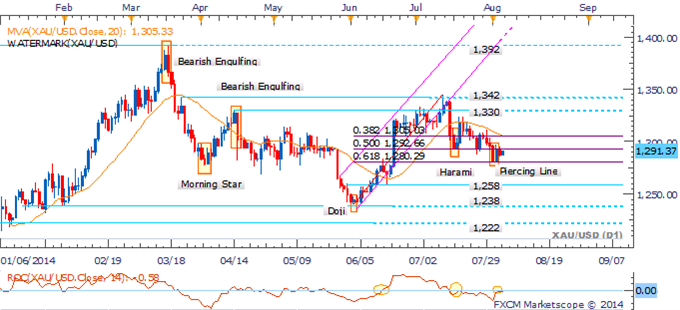
Gold: Downside Risks Remain Sub 1,292
The emergence of a short-term downtrend for Gold casts the immediate risk to the downside with a break of 1,280 (61.8% Fib) to open 1,258. A Piercing Line pattern near the nearby floor failed to find follow-through. This in turn casts doubt on the potential for a recovery. Sellers are likely to emerge at the 1,305 mark.
Silver: Woes May Continue With $20.00 Handle In Focus
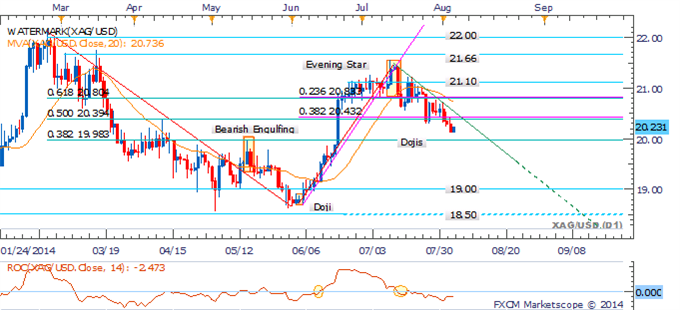
Silver’s failure to hold above the 20.43 mark (38.2% Fib Level) suggests the potential for further weakness. At this stage bullish reversal patterns are seemingly lacking which puts the spotlight on the psychologically-significant 20.00 handle.
Copper: Awaiting Break To Offer Directional Bias
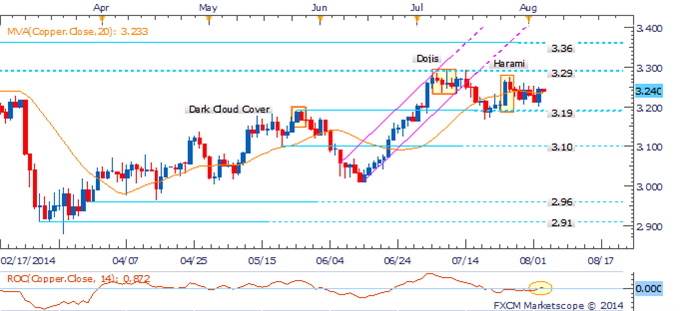
Copper has demonstrated fairly choppy price action over the past several weeks which leaves a mixed technical bias for the commodity. A break of the 38.2% Fib Level at 3.19 would be required to shift the immediate risk to the downside.
Palladium: Threatens Break of Ascending Trend Channel
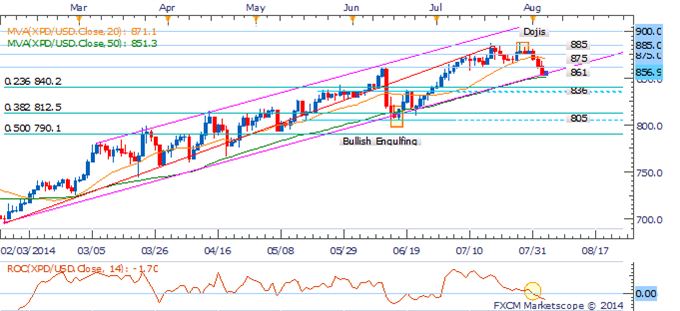
Palladium’s pullback has been met by some buying support at the bottom of its ascending trend channel. At this stage the medium-term uptrend remains in force, although negative momentum (signaled by the ROC) is a cause for concern. Given the risk of a downside break, a push back above the 861 mark alongside a bullish candlestick pattern would be preferred before adopting new long positions.
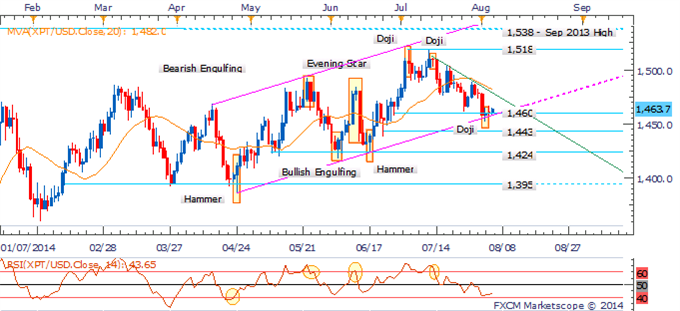
Platinum: Doji Highlights Indecision Near Trend Channel Bottom
Platinum is at a critical juncture as the precious metal threatens a break of its ascending trend channel. While evidence of a short-term downtrend exists a Doji formation indicates some hesitation by the bears. A break above the descending trendline would be required before suggesting new long positions.
