Our research team has identified a potential major price rotation setup in crude oil that may be one of the biggest opportunities for traders in a long while. Traders need to be aware of this potential move because it could coincide with other news related to foreign markets/economies as well as supply/demand issues throughout the rest of this year.
Demand for oil is tied to the economic activities throughout much of the globe. When demand for oil is high, one can perceive the global economy to be performing well and consumer demand for oil-based products rather high. When demand for oil subsidies, it is usually due to economic constraints as a result of slower consumer and industrial demand. The only time demand for oil typically skyrockets is when massive supply disruption takes place or war breaks out.
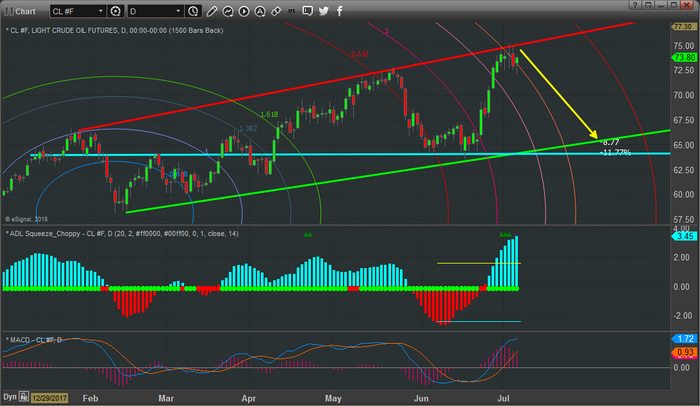
Current price rotation to the upside has reached and stalled near an upper price channel and coincides with our Tesla (NASDAQ:TSLA) Vibrational Theory price arcs. We believe this could be setting up for a big downside price move in the near future. Our interpretation of this setup is that oil will quickly find pricing pressures near the $74-$75 level and begin to move lower.
Before we continue much further, let’s take a look at some statistical data for the Month of July with crude oil. Over 36 total months of scanned data (data going all the way back to 1983) we can determine the following :
** All data related only to the month of July **
- Total price activity over those 36 total months:-$5.28
- Total Monthly Positive Results = $49.78 spanning 24 total months – Averaging $2.07
- Total Monthly Negative Results = -$55.06 spanning 12 total months – Averaging -$4.59
- Largest Positive Month = +$8.47
- Largest Negative Month = -$15.92
This data tells us that July more often resultis in a positive price move (by a 2:1 ratio), yet the upside totals do not out perform the downside moves. The downside price moves for July total nearly 10% more than the total upside price moves and equates to exactly half the number of instances (12 vs. 24).
This data suggests to us that any potential downside move in crude could be well in excess of -$4.00 and could be as large as -$10.00 or more. If our analysis is correct, crude could rotate much lower based on our price channels and Tesla theory setup, we could be in for a move to below $64.00 ppb here soon if price confirms a breakdown on a close below $72.
This daily crude oil chart shows the wedge formation and our Tesla price vibrational arcs that we believe are set up for a potential downside price rotation move. Obviously, we can see that oil has rotated within this channel at least twice before – which is why we believe this current downside rotation could have a high probability of happening. Additionally, our predictive modeling system is suggesting price weakness this week in crude oil.

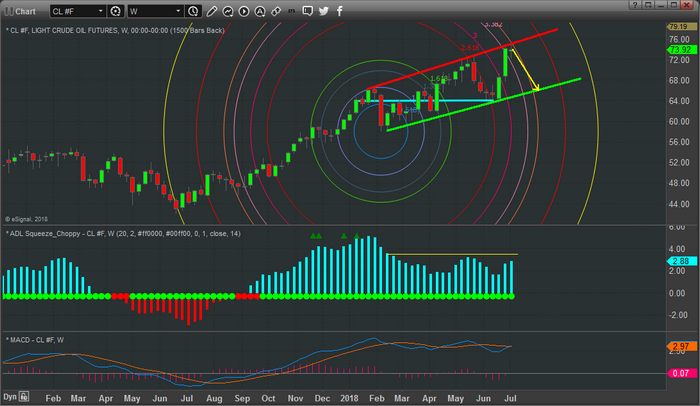
This weekly crude oil chart below shows the same pattern over a longer span of time. Our belief is that the $64.00 support level (shown as a horizontal CYAN support line) will be retested over the next 2~5+ weeks if this projected price rotation plays out, it could mean that if the $64.00 level is breached, we could see oil fall to well below $60.00 ppb headed into the end of this year.

Consider this piece of data for a minute as we consider this possible price rotation. Since 1983, using quarterly price data, the Q4 historical data show us the following:
- Total Q4 Price Move: -$80.71 over 36 Q4 data points
- Total Positive Q4 Data: +$85.87 over 14 data points – Averaging +$6.13
- Total Negative Q4 Data: -$116.58 over 21 data points – Averaging -$7.93
- Largest Q4 upside move: +$19.63
- Largest Q4 downside move: -$56.04
Downside price action in crude oil is nearly 33% more predictable than upside price action in Q4 with the largest price changes reflecting almost +300% greater chance of downside price collapse than upside price rally.
We may be a bit early with our prediction near this upper price channel, but we believe this could be a super trade going into the end of this year. We just have to wait for the move to accelerate and begin to rotate lower.
