Bullish price action in crude oil since early November
The price stops short of a critical technical resistance level
Higher prices are likely, but buying dips could reduce stress
OPEC will push prices higher as U.S. energy policy shifts to a greener path
- Buy oil when it looks its worst
Bull markets tend to push prices to levels much higher than market participants think possible. As we learned on April 20, 2020, bear markets do just the opposite. Few experts believed that the energy commodity would ever fall to a negative price, much less negative $40.32 per barrel.
A confluence of events, including the global pandemic, OPEC failing to address evaporating demand immediately, and no storage for landlocked crude oil in Cushing, Oklahoma, pushed the price to an unthinkable level on the downside.
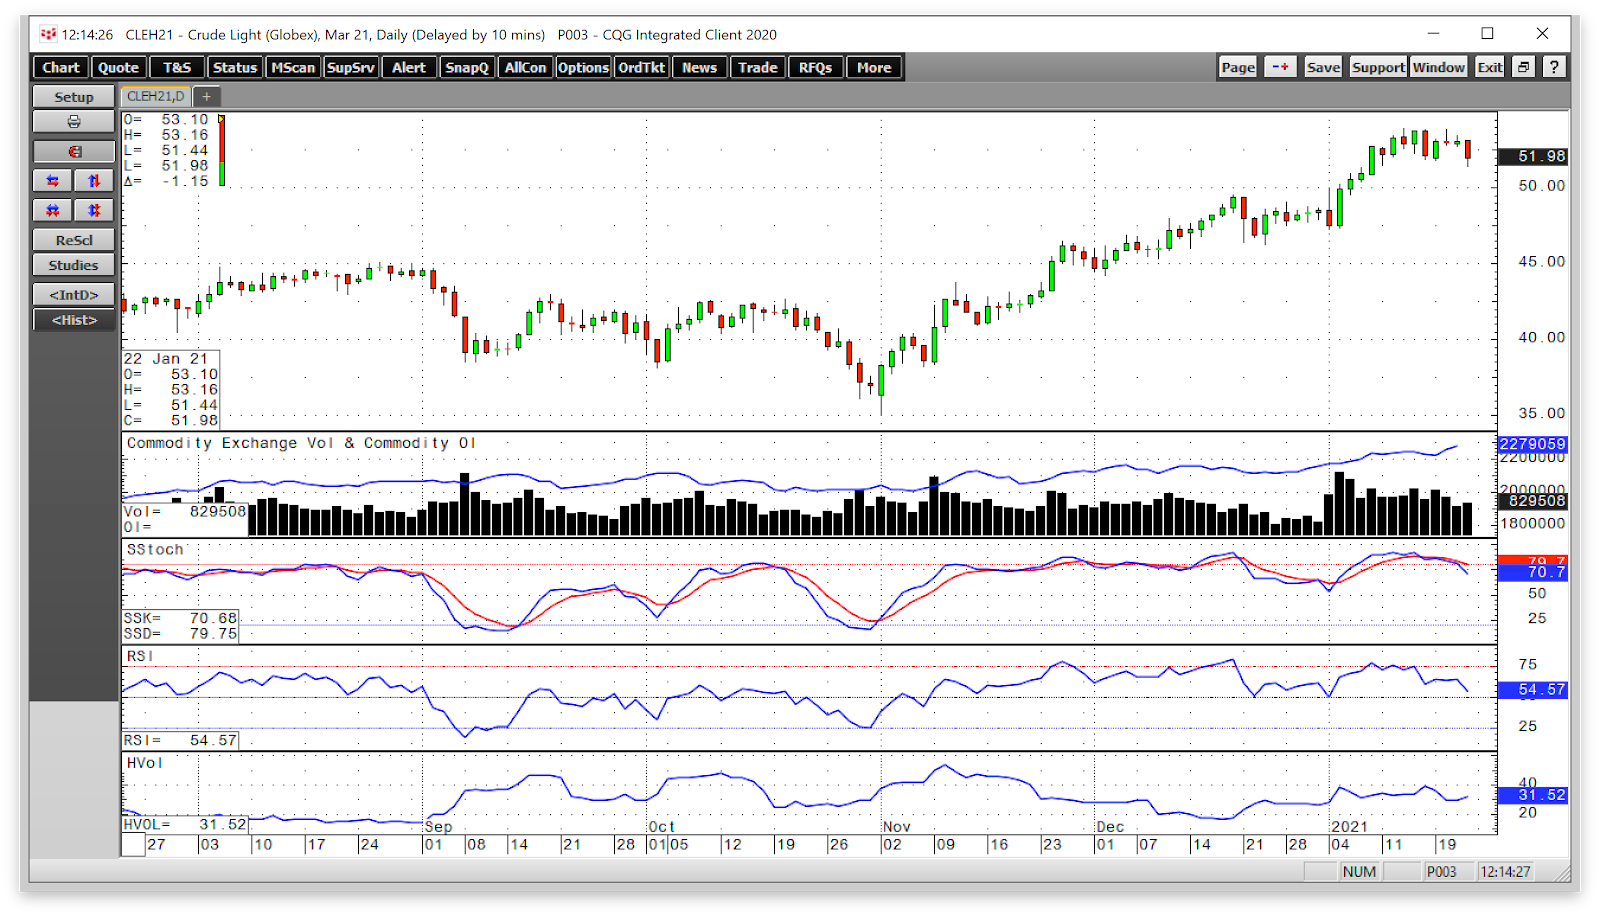
Since late April, crude oil has been on the stairs higher, reaching almost $54 per barrel on the nearby March NYMEX futures on Jan. 13. The rally over the past months has not been in a straight line.
In late October, NYMEX crude oil futures corrected, but the move lower ended on Nov. 2 when the price action reversed. The NYMEX futures put in a bullish reversal on the daily chart on the first trading session of November, on the monthly chart on Nov. 30, and on the quarterly chart on Dec. 31. In January, the price moved above $50 per barrel for the first time since February 2020, but the energy commodity could be running into some trouble as it approaches a critical technical resistance level at the mid-February 2020 peak.
The United States Oil Fund (NYSE:USO) tracks the price action in a portfolio of actively traded futures contracts on the CME’s NYMEX division. Even the most aggressive bull markets have speed bumps, and crude oil could be near another during the first month of 2021.
Bullish Price Action In Crude Oil Since Early November
Over the past week, NYMEX February WTF crude oil futures rolled from February to March.

Source: CQG
The daily chart of the now active month March contract shows that the energy commodity rose from a low of $35 on Nov. 2 to a high of $53.94 on Jan. 13. At around the $52 level at the end of last week, WTI crude oil’s trend remains bullish but it threatening to turn lower. Price momentum and relative strength indicators were well above neutral readings, with the slow stochastic in overbought territory. However, both have crossed lower over recent sessions. The total number of open long and short positions rose from around 2.04 to 2.28 million contracts from Nov. 2 through Jan. 24. Increasing open interest as the price of a futures contract moves higher is typically a technical validation of a bullish price trend. Daily historical volatility at just over 31.5% remains elevated as daily trading ranges have been wide.
Price Stops Short Of Critical Technical Resistance Level
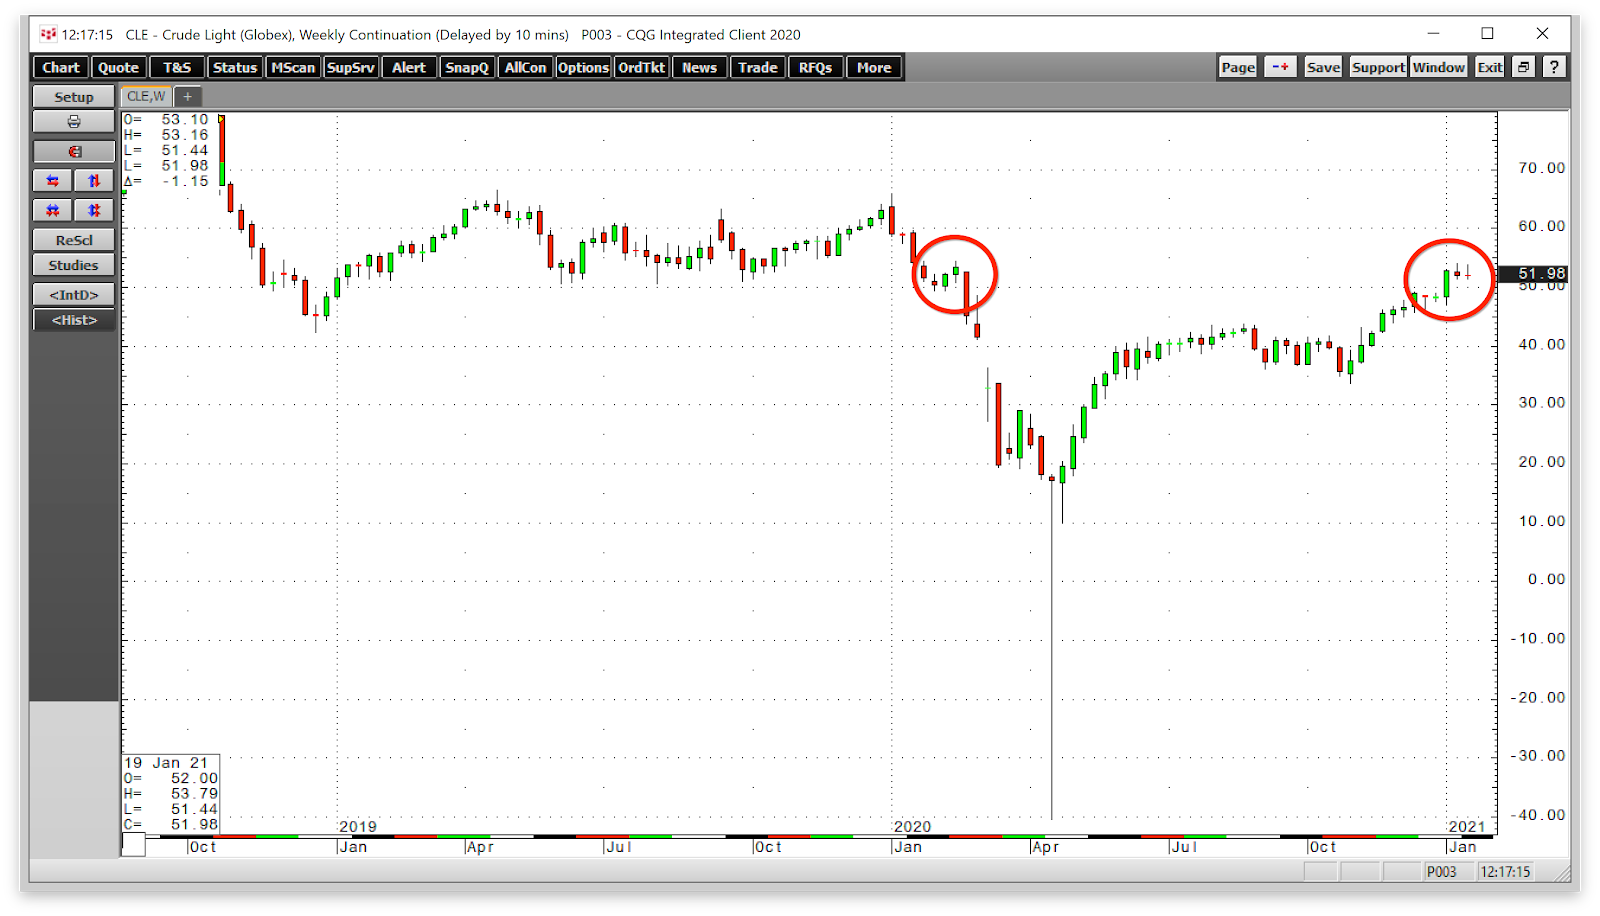
Since the late April 2020 low, crude oil’s price has made an impressive comeback, rising by over $84 per barrel from the low on the continuous futures contract.

Source: CQG
The weekly chart shows that the price appreciation is stalling near the first level of critical technical resistance at the mid-February 2020 $54.50 high. If oil breaks through that level, the next upside target stands at the early January 2020 peak of $65.65 per barrel.
Higher Prices Likely, But Buying Dips Could Reduce Stress
The trend is always your best friend in markets, and it is higher in crude oil. After the upside price action stalled at just below $44 per barrel in October, the price corrected to a low of $33.64. Memories of the price action in late April likely pushed the energy commodity lower as speculators flocked to the short side during the $10 or over 23% decline. However, the price snapped back and moved to a higher high in under one month. By the end of November 2020, crude oil was above $45 per barrel.
I favor the upside in crude oil because the trend remains higher. However, I would not be surprised to see another correction in the energy commodity as it works its way to higher highs. Buying crude oil on price weakness could be the optimal approach as it improves the odds of success in a bullish trend. If crude oil is heading for a test of the 2020 $65.65 high, buying on price dips will lower the stress of carrying a long position through a correction. There are never any guarantees in the world of commodities but buying on weakness in medium to long-term bull markets typically yields the best results.
OPEC Will Push Prices Higher As U.S. Energy Policy Shifts To Greener Path
After agreeing to taper the 7.7-million-barrel-per-day production cut by 500,000 barrels per month in January through March, Saudi Arabia surprised the market with a one million barrel per day reduction in output in early January. The Saudi cut allows Russia’s production to increase, but the news sent the price of crude oil higher and over the $50 per barrel level on nearby NYMEX futures for the first time since February 2020.
While OPEC+ tinkers with production levels to balance the energy commodity’s fundamental equation, the cartel leaders, Saudi Arabia and Russia, also realize that the pricing power will shift back to their hands under the Biden administration.
As U.S. energy policy begins to move down a greener path, it will be easier for OPEC+ to fulfill its mission of providing the highest possible return for its members. The surprise production cut from the Saudis could have been a test of the cartel’s increased pricing power. Crude oil moved higher after the cut, which is a passing grade for Saudi Arabia and the Russians.
Buy Oil When It Looks Its Worst
Even the most aggressive bull markets suffer sharp corrections. If crude oil is heading higher over the coming months and years, buying during selloffs will offer the optimal path for profits. Therefore, look to buy when the price action looks its worst.
If 2008 through 2011 is a model for crude oil and all commodities, the central bank liquidity and government stimulus will have inflationary ramifications. In 2008, the nearby NYMEX crude oil price fell to a low of $32.48 per barrel. By 2011, the price peaked at nearly $115.
The trend in the oil market remained higher as of the end of last week. Bull markets often experience speed bumps on the way to new highs. Using those periods to hop on the bullish trend could be the best plan for 2021.
