Get 40% Off
👀 👁 🧿 All eyes on Biogen, up +4,56% after posting earnings. Our AI picked it in March 2024.
Which stocks will surge next?
Unlock AI-picked Stocks

Crude Oil Futures Technically Overbought

Published 02/22/2022, 12:54 PM
Updated 07/09/2023, 06:32 AM

It's hard to score profits by trading on news headlines, and the current environment makes it even harder. We prefer to rely mainly on technical analysis instead, and right now, technical factors make a good case that crude oil is reaching "overbought" territory. Here we explore what the charts say about Crude Oil WTI Futures.

At the start of the pandemic, when front-month future prices briefly went negative, we felt confident in calling it the end of the downward corrective pattern that had begun in 2008. On a continuous-contract chart like the one shown below, the April 2020 low was 3.48 (above zero), but it still remained a durable low.

With that as a foundation, our next step has been to look for the underlying structure in the climb out of the hole. This is where Elliott wave methods can be so helpful because they provide an almost an x-ray view into market sentiment. Right now, we are looking for an impulsive (five-wave) pattern, the completion of which will mean bullish sentiment has peaked.


On the weekly chart, we can count five waves up following the classic impulsive form:

  • Wave (i) acted as a decisive signal to technical traders that the market had been overextended to the down side.
  • Wave (ii) gave some bullish traders a chance to catch their breath or reposition, while the "dumb" money was looking for downward continuation.
  • Wave (iii) was the strongest, making it hard for late-comers to get on board.
  • Wave (iv) was the embodiment of "indecisive"
3rd party Ad. Not an offer or recommendation by Investing.com. See disclosure here or remove ads .

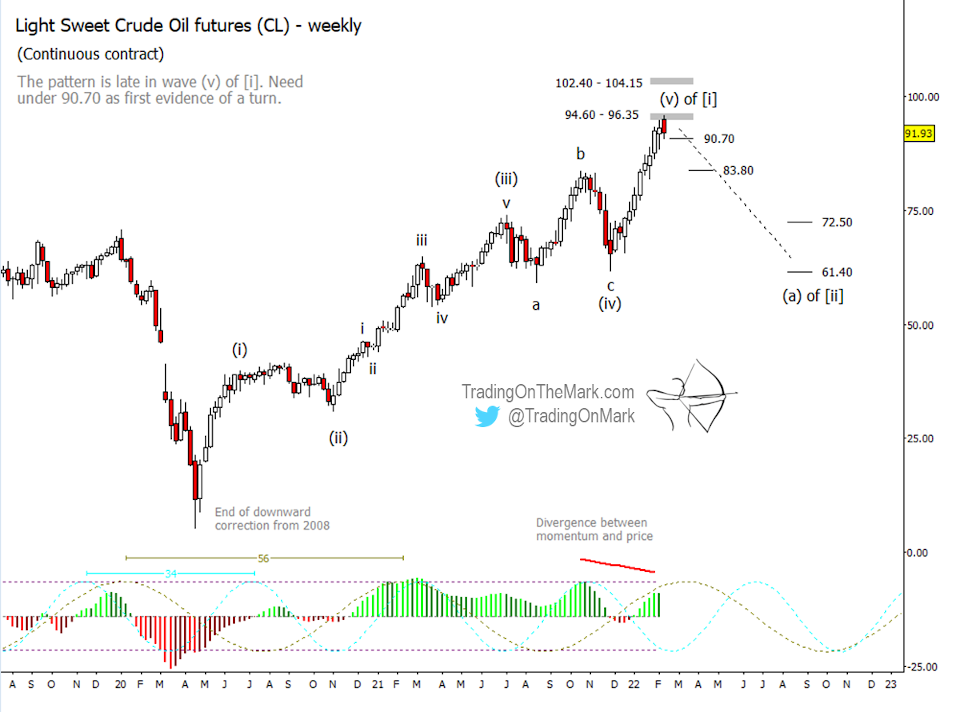
Now we're probably witnessing the completion of upward wave (v) to finish the pattern. Note how price has been contending with the first band of Fibonacci-based resistance near 94.50 to 96.35. Another resistance band might serve as a backstop near 102.40 to 104.15.

Note also the divergence between our preferred momentum tool and price. Momentum is printing a lower high right now.

The first confirmation signal for crude oil bears who are trading on this time frame would be a weekly close beneath 90.70. As of this writing it looks as though that might happen very soon, but we can't rule out another test of resistance. An international security scare could cause that to happen regardless of technicals.

When the decline begins in earnest, we'll be watching support near 83.80 and expecting it to break eventually. Lower targets await near 72.50 and 61.40. The lower of those probably represents the bottom of what will become a new range for traders, with the area near current highs capping the range.

Dominant price cycles of 34 weeks and 56 weeks suggest an ideal time for a price low would be around October or November 2022, and that might represent the bottom of the first leg of a correction.

Latest comments

EIA expects U.S. petroleum trade to shift toward net imports during 2022. USA production will fall significantly, and never return to 13.1 mbpd.
Awesome. Same sentiments
Awesome. Same sentiments!
Awesome. Same sentiments! 🥂
Demand reached pre-pandemic level, but production, inventory, and rig count are far below pre-pandemic level. It will take a few years for USA production to reach 13.1 again.
great analysis👍
Awesome technical analysis!
Correct. But greedy big hands will try to lure more retailors to buy for them to take huge profit.
one recommendation sir, you have not been localized your wave count
Risk Disclosure: Trading in financial instruments and/or cryptocurrencies involves high risks including the risk of losing some, or all, of your investment amount, and may not be suitable for all investors. Prices of cryptocurrencies are extremely volatile and may be affected by external factors such as financial, regulatory or political events. Trading on margin increases the financial risks.
Before deciding to trade in financial instrument or cryptocurrencies you should be fully informed of the risks and costs associated with trading the financial markets, carefully consider your investment objectives, level of experience, and risk appetite, and seek professional advice where needed.
Fusion Media would like to remind you that the data contained in this website is not necessarily real-time nor accurate. The data and prices on the website are not necessarily provided by any market or exchange, but may be provided by market makers, and so prices may not be accurate and may differ from the actual price at any given market, meaning prices are indicative and not appropriate for trading purposes. Fusion Media and any provider of the data contained in this website will not accept liability for any loss or damage as a result of your trading, or your reliance on the information contained within this website.
It is prohibited to use, store, reproduce, display, modify, transmit or distribute the data contained in this website without the explicit prior written permission of Fusion Media and/or the data provider. All intellectual property rights are reserved by the providers and/or the exchange providing the data contained in this website.
Fusion Media may be compensated by the advertisers that appear on the website, based on your interaction with the advertisements or advertisers.
© 2007-2024 - Fusion Media Limited. All Rights Reserved.