Crude Oil is edging lower in Asian trading, erasing some of Friday’s dramatic gains. The commodity has demonstrated a hyper-sensitivity to news flow related to geopolitical turmoil, which may leave it in store for further volatility over the week ahead. Meanwhile, Gold and Silver are in a precarious position as the latest flare-up in regional tensions has proven insufficient to support the precious metals.
Geopolitical Developments Catalyze Commodity Volatility
Incoming news flow surrounding the ongoing conflicts in Eastern Europe and Iraq may see crude oil continue its wild price swings. The WTI benchmark soared on Friday to post its largest daily percentage gain in more than a month as newswires reported escalating tensions in Ukraine and the Middle East.
Speculation over crude supply disruptions from Russian and Iraqi holds the potential to spark fear-driven buying of WTI and Brent. Palladium has also likely benefited from concerns over supply from Russia (the world’s largest producer of the metal). The commodity has climbed to its highest level in more than 13 years after rallying for eight consecutive trading days.
However, looking past the headlines production impediments related to the ongoing sagas have proven minimal at this stage (if not non-existent). This suggests that any related risk-premium built into prices could quickly evaporate, leaving the commodity vulnerable to declines.
Haven Demand Deteriorates
The latest geopolitical flare-ups have proven insufficient to bolster safe-haven demand for gold and silver. The yellow metal has continued its descent during the Asian session today, extending Friday’s decline of 0.67 percent.
Ongoing uncertainty surrounding Eastern Europe could slow the precious metals fall. However, without a material escalation it remains to be seen what could cause investors to return to gold and sustain a recovery for the precious metal.
CRUDE OIL TECHNICAL ANALYSIS
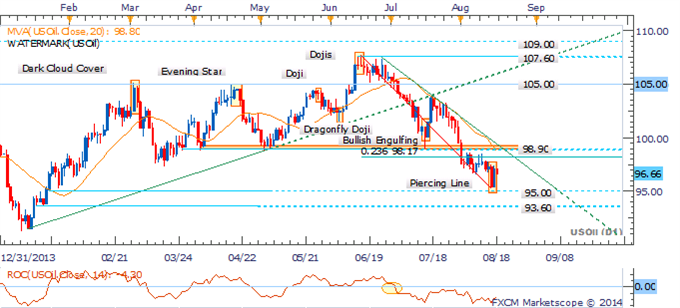
Downside risks remain for crude with the recent recovery being viewed as a corrective bounce at this stage, rather than the beginning of a reversal. A sustained downtrend alongside negative momentum (signaled by the ROC) suggests the potential for further weakness over the coming weeks. A daily close above the descending trendline and 98.90 barrier would be required to signal a shift in sentiment to the upside and to mark a small base.
Crude Oil: Recovery Seen As Corrective Within Downtrend Context
GOLD TECHNICAL ANALYSIS
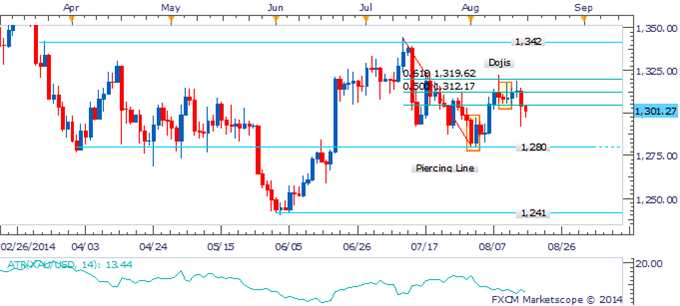
Gold has edged out a marginal close below the 1,305 floor that had kept the precious metal supported over recent weeks. While intraday declines are being witnessed a more convincing break is required to materially shift the risks to the downside. Sustained weakness would likely be met by buying interest near the July lows at 1,280. A climb back within the 1,305 to 1,320 trading band would suggest a renewed range-bound environment.
Gold: Awaiting Clearer Break Of Range To Open 1,280
SILVER TECHNICAL ANALYSIS
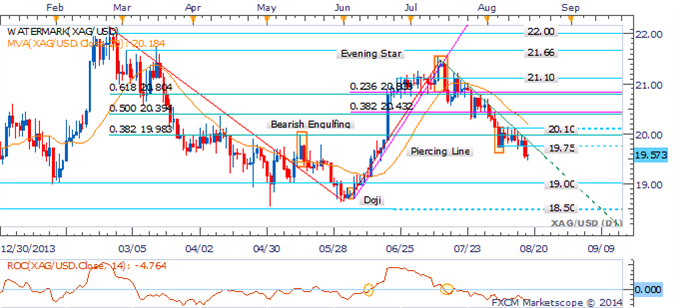
The 19.75 barrier has finally been breached for silver, which casts the spotlight on the psychologically-significant 19.00 handle. The sustained presence of a short-term downtrend on the daily reinforces the prospect of further weakness for the precious metal. A daily close above the descending trendline and 20.10 ceiling would be required to shift the bias to the upside.
Silver: Breaches 19.75 Barrier To Target 19.00
COPPER TECHNICAL ANALYSIS
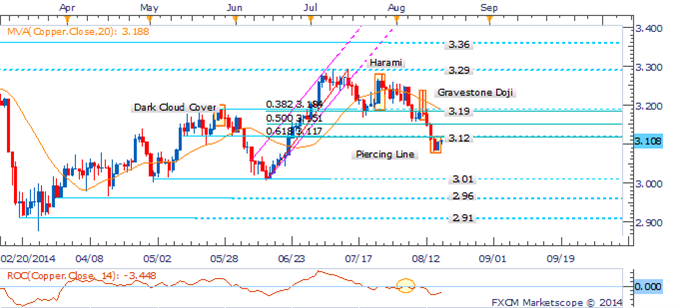
Copper has completed a double top formation with a break of the baseline suggesting the potential for further weakness. The daily close below the 3.117 mark (61.8% Fib) sets the stage for a descent to the base metal’s May lows near 3.01. A climb back above the 3.19 hurdle would be required to negate a bearish technical bias.
Copper: Double Top Formation Keeps Immediate Risk Lower
PALLADIUM TECHNICAL ANALYSIS
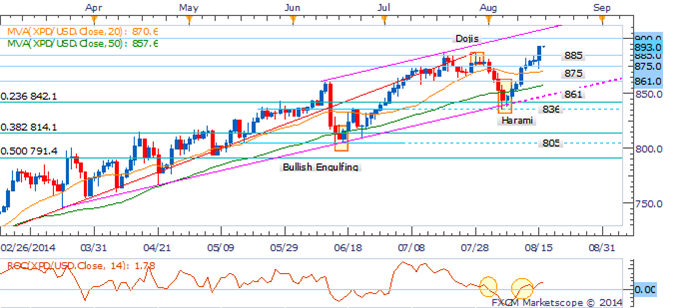
Palladium has continued its journey to the 900 target offered in recent reports. An absence of bearish reversal candlesticks and sustained uptrend suggests the potential for further gains. However, after having posted eight straight days of gains a corrective pullback may be in order. Buyers are likely to emerge at former resistance-turned-support near 885.
Palladium: Targeting Psychologically-Significant 900 handle
PLATINUM TECHNICAL ANALYSIS
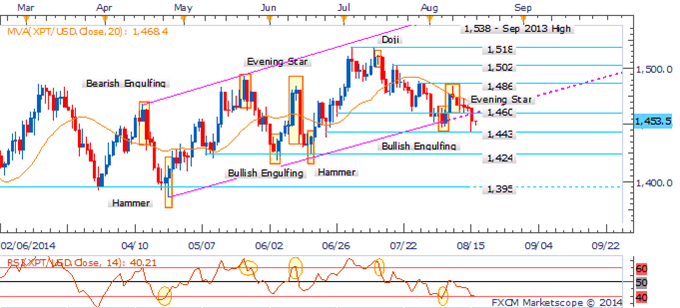
Platinum may face further weakness following its clearance of the ascending trend channel on the daily. This is reinforced by the sustained presence of a downtrend (denoted by the 20 SMA), as well as an Evening Star formation near 1,486. A daily close below the nearby 1,443 barrier would open the July lows near 1,424.
Platinum: Crashes Through Trendline Support
