It was a good week for the crude oil market, which has been under pressure for over a month. WTI climbed to as high as $75.24 on July 3rd, but the bulls could not keep the positive momentum, which led to a decline to as low as $64.40 by August 15th. And just when it looked like a downtrend was forming, the price made a U-turn and rose to $69.29 last Friday.
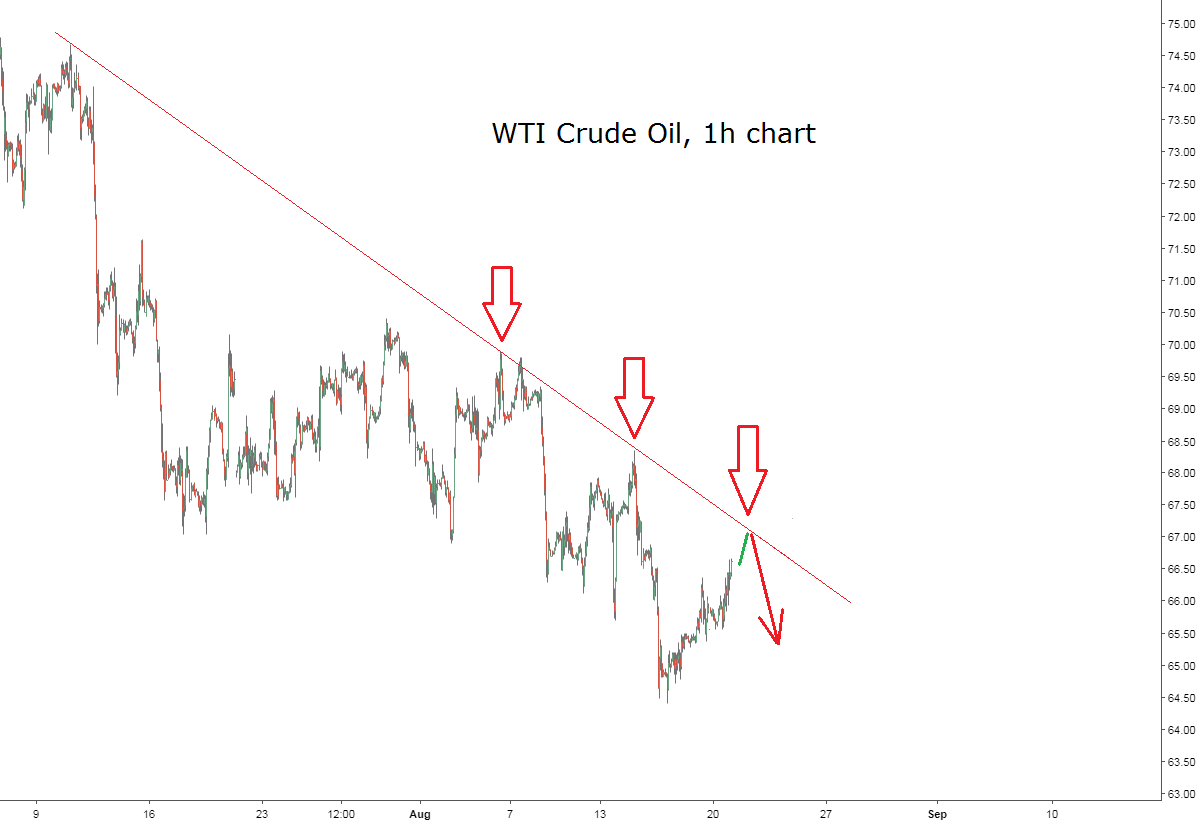
Last week’s rally was even more surprising to those traders, whose short positions have been relying on the trend line shown below to serve as resistance and cause another selloff.
Trend lines are among the most powerful weapons conventional technical analysis can offer. Following their logic, WTI crude oil was supposed to touch the declining trend line drawn through the last three swing highs and head down for the fourth time. Unfortunately, trend lines work until they don’t. In order to recognize when it is time for a trend line to break, traders have to take a different perspective into the behavior of the markets. An Elliott Wave perspective.
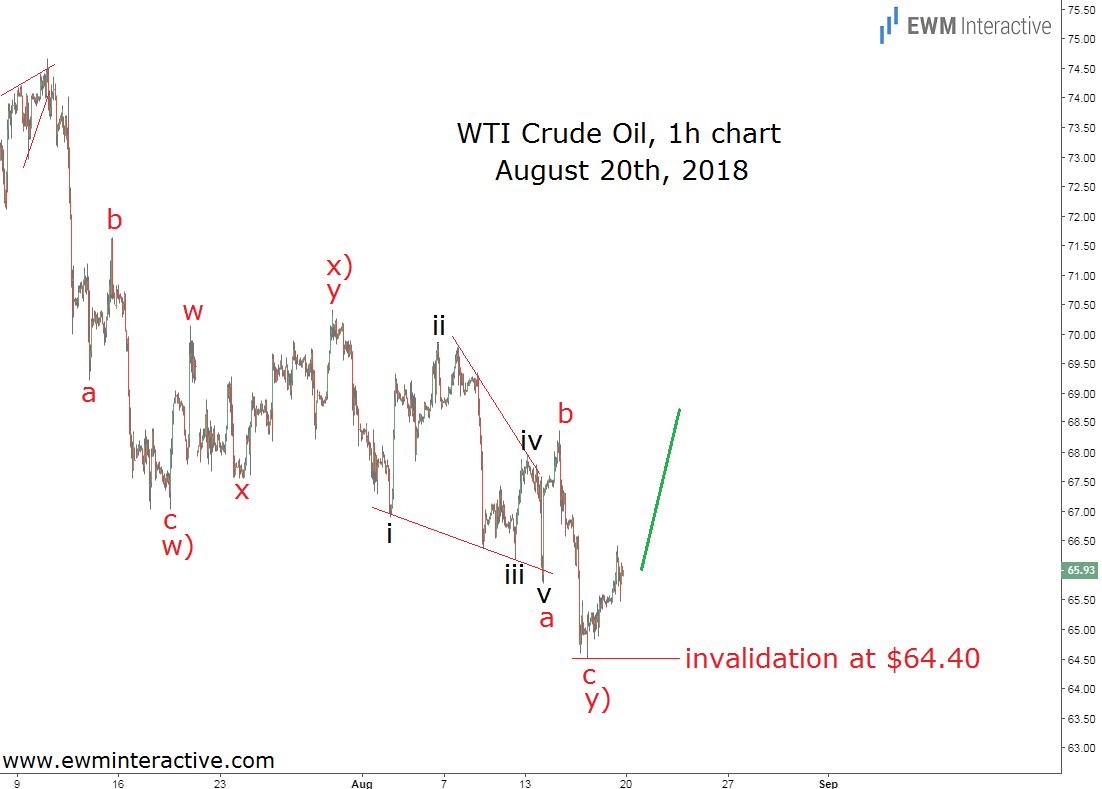
For instance, the above-shown chart looked a lot different – and bullish – when examined through the prism of the Elliott Wave Principle. The next analysis was sent to our subscribers before the open on Monday, August 20th.
With our Elliott Wave glasses on, it became evident that crude oil’s drop was a w)-x)-y) double zigzag correction. Waves w) and y) were simple a-b-c zigzags, while wave x) was a smaller double zigzag, labeled w-x-y. Wave “a” of y) appeared to be a leading diagonal. The entire corrective pattern seemed to be complete, which meant that at least in the short term, WTI crude oil prices could be expected to change direction. Therefore, the bulls were going to remain in charge as long as $64.40 was intact. The area above $69 a barrel looked like a natural target to the upside. This Elliott Wave count also meant the declining trend line the bears were betting on was not very reliable. A week later now, here is an updated chart.
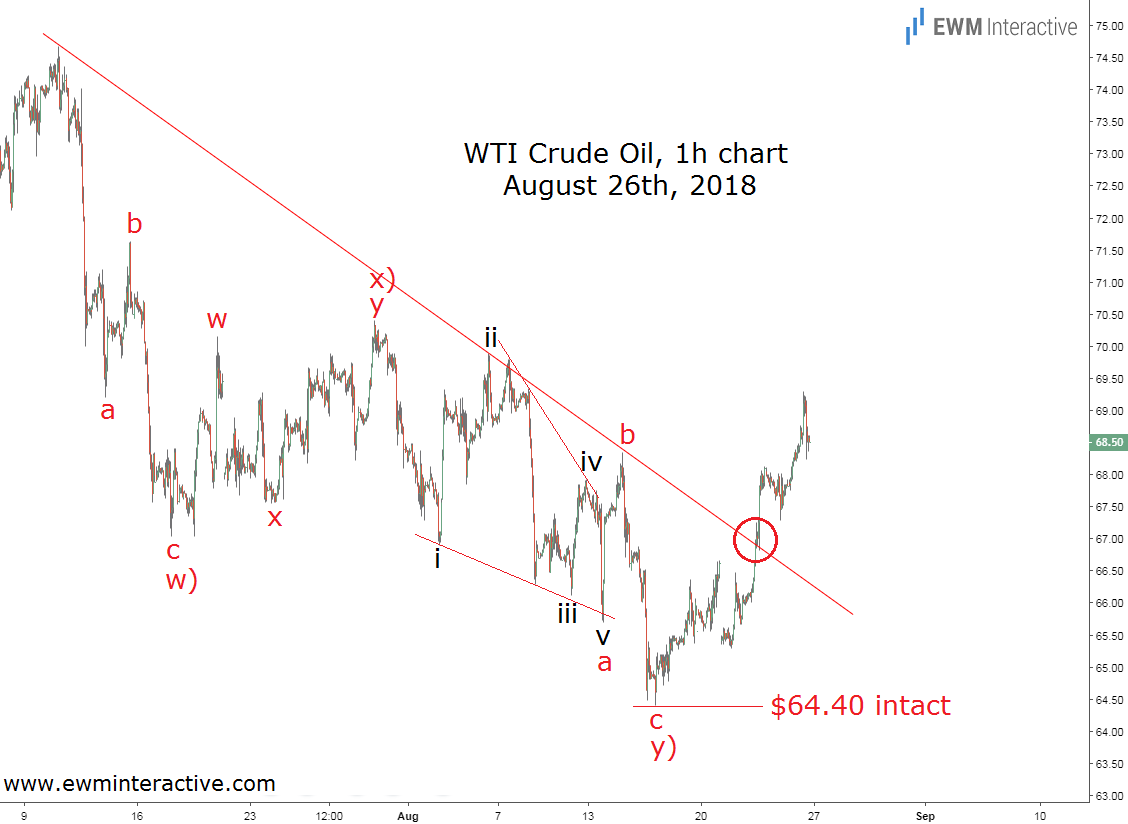
Crude oil fell to a weekly low of $65.29 on Tuesday, August 21st, but the invalidation level at $64.40 was never really tested. On Wednesday, August 22nd, the price went straight through the declining trend line like it was nothing. Other sources attribute the rally to the decline in the U.S. oil rig count, the North Sea strike and the supply drop from Iran. The problem is that traders, who have been waiting for the news to make up their mind, were inevitably late to the party.
