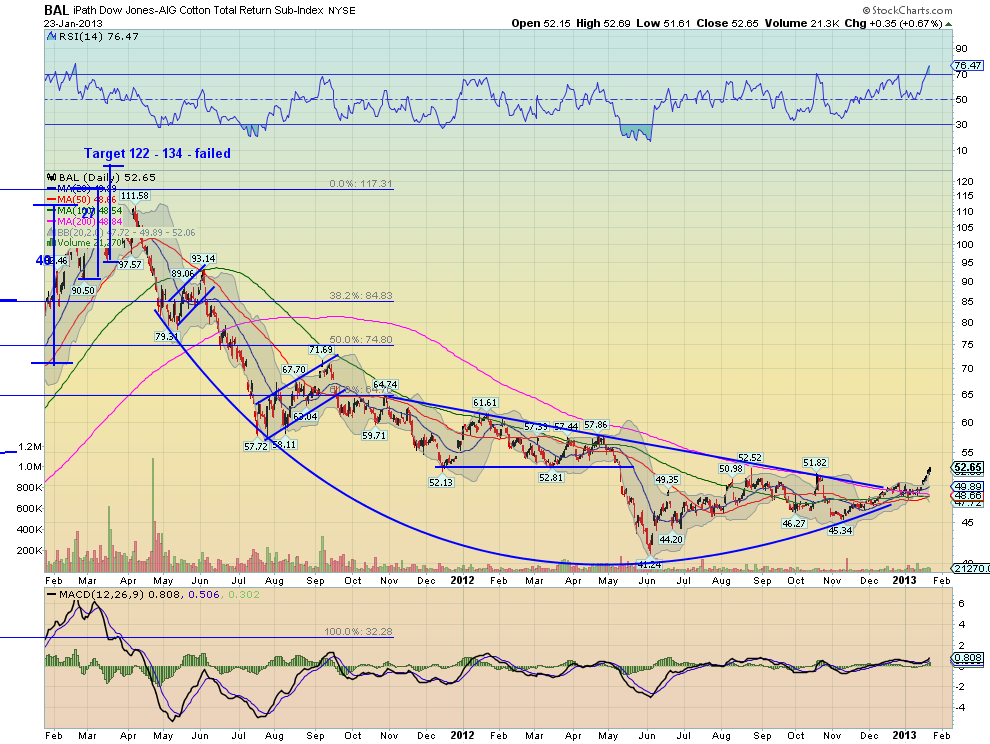
The commodity complex has moved lower since mid 2011 and there are many eyes on this space. Cotton (BAL) is no exception.
The chart below shows the rounded bottom and move higher of the iPath DJ-UBS Cotton Total Return Sub-Index ETN (BAL) accompanied by a break of the long downtrending resistance line. It is also moving higher over all of the tightly bunched Simple Moving Averages (SMA). All is well and time to jump on board for the next move higher right?
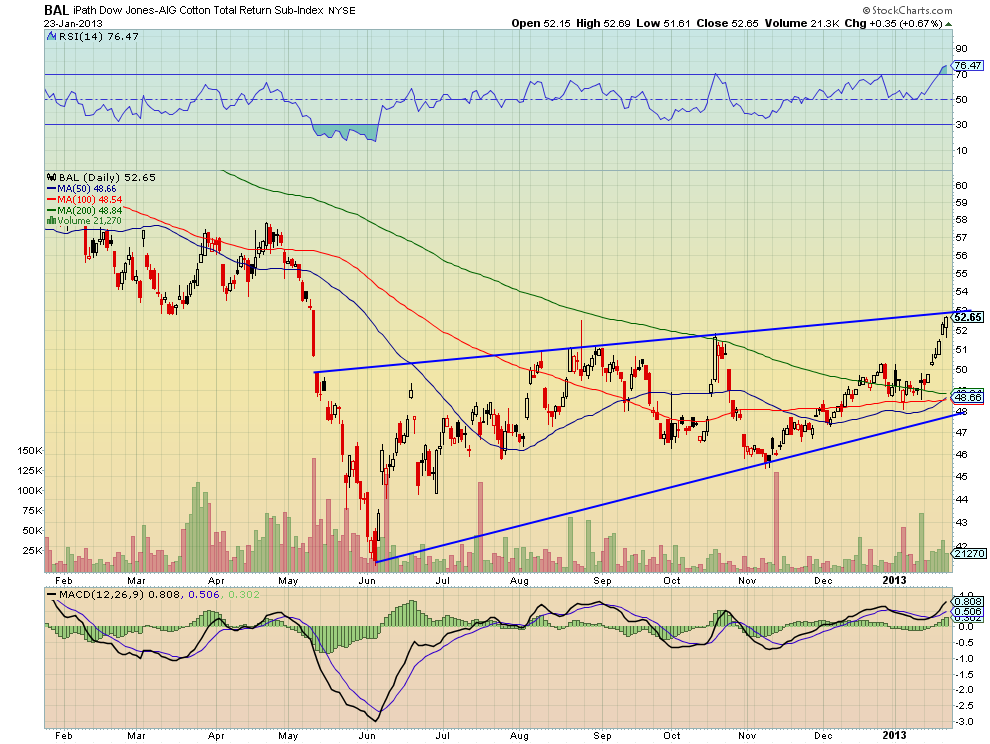
Not quite so fast. There is one caution flag in this chart. The Relative Strength Index (RSI) has become technically overbought, over 70. You can see from the previous oversold signals (RSI under 30) that the stock can still continue in the current trend being overbought for a while, but it is hard to justify a new entry at this point.
And this makes sense if you look closely in on the last 6 months. The rising wedge off of the bottom will be interpreted by many as a potentially bearish sign. And it will take a break over the top to dissuade them.
If this were to happen soon, there is still that troublesome RSI to deal with. Ideally some consolidation at the top of the range to work off the RSI Overbought condition and then a break over 53 can be bought looking for a move to 58. 
Else-wise, a pullback to the SMA looks like the best entry. Of course the market could just go higher and not give you either one of those. In that case, look somewhere else for a trade.
Disclosure: The information in this blog post represents my own opinions and does not contain a recommendation for any particular security or investment. I or my affiliates may hold positions or other interests in securities mentioned in the Blog, please see my Disclaimer page for my full disclaimer.
Original post
- English (UK)
- English (India)
- English (Canada)
- English (Australia)
- English (South Africa)
- English (Philippines)
- English (Nigeria)
- Deutsch
- Español (España)
- Español (México)
- Français
- Italiano
- Nederlands
- Português (Portugal)
- Polski
- Português (Brasil)
- Русский
- Türkçe
- العربية
- Ελληνικά
- Svenska
- Suomi
- עברית
- 日本語
- 한국어
- 简体中文
- 繁體中文
- Bahasa Indonesia
- Bahasa Melayu
- ไทย
- Tiếng Việt
- हिंदी
Cotton Is Weaving A Complicated Story
Published 01/24/2013, 12:03 AM
Updated 05/14/2017, 06:45 AM
Cotton Is Weaving A Complicated Story
3rd party Ad. Not an offer or recommendation by Investing.com. See disclosure here or
remove ads
.
Latest comments
Install Our App
Risk Disclosure: Trading in financial instruments and/or cryptocurrencies involves high risks including the risk of losing some, or all, of your investment amount, and may not be suitable for all investors. Prices of cryptocurrencies are extremely volatile and may be affected by external factors such as financial, regulatory or political events. Trading on margin increases the financial risks.
Before deciding to trade in financial instrument or cryptocurrencies you should be fully informed of the risks and costs associated with trading the financial markets, carefully consider your investment objectives, level of experience, and risk appetite, and seek professional advice where needed.
Fusion Media would like to remind you that the data contained in this website is not necessarily real-time nor accurate. The data and prices on the website are not necessarily provided by any market or exchange, but may be provided by market makers, and so prices may not be accurate and may differ from the actual price at any given market, meaning prices are indicative and not appropriate for trading purposes. Fusion Media and any provider of the data contained in this website will not accept liability for any loss or damage as a result of your trading, or your reliance on the information contained within this website.
It is prohibited to use, store, reproduce, display, modify, transmit or distribute the data contained in this website without the explicit prior written permission of Fusion Media and/or the data provider. All intellectual property rights are reserved by the providers and/or the exchange providing the data contained in this website.
Fusion Media may be compensated by the advertisers that appear on the website, based on your interaction with the advertisements or advertisers.
© 2007-2024 - Fusion Media Limited. All Rights Reserved.
