If you are fortunate enough to have $750,000 equity in a $1,000,000 home, and a fire ravages the property, what is your number one concern? The protection of the equity.
Granted, you might be extremely curious about how the fire started. You may even want to know whether or not there was something you could have done differently to prevent the disaster. Nevertheless, you would be far more focused on the insurance coverage that would allow you to rebuild and recover than you would be interested in causation.
Perhaps ironically, I continue to field comments and e-messages about WHY the stock market will levitate for years to come. Some insist, “Ultra-low rates will continue to drive stock prices higher.” And I provide extensive data for the 20-year period (1936-1955) when ultra-low rates did not stop four brutal bears from eviscerating stock prices.
Others opine, “Recessions cause stock bears, and there’s no recession in sight.” So I proffer ample data for the four non-recession bears since 1950, while noting another two non-recession instances with 19%-plus depreciation. Then I document the reality that U.S. stock assets had already descended into bear territory in 2000’s tech wreck as well as 2008’s financial crisis, long before prominent economic minds had acknowledged either recession.
Bear market causation is less relevant than your ability to protect your portfolio from the bulk of bearish damage. Do you need to fully appreciate the reason or reasons why bears occur in order to safeguard your net worth? Not really. What you need are indicators that possess a long history of high correlations with future returns.
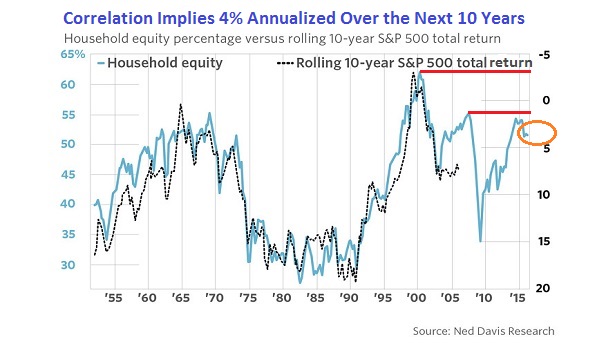
For example, the higher the percentage of household financial assets invested in stocks, the lower the stock market’s subsequent 10-year return. One might speculate as to the reasons why this is the case. However, the primary thing that matters is the fact that this predictor has an astonishing track record. Household equity percentage possesses a .91 correlation with subsequent 10-year results. That is even more efficacious than market-capitalization-to-GDP (0.76) – a stock valuation tool that many refer to as the “Warren Buffett Indicator.”
The percentage of household financial assets invested in equities currently rests at 52%. According to Ned Davis Research, allocation percentages at these heights historically correspond to 10-year annualized total returns around 4%. Equally compelling? Similar 10-year results can be traced back to the late 1960s, while the household equity percentage record peak in 2000 provided negative 10-year total returns.
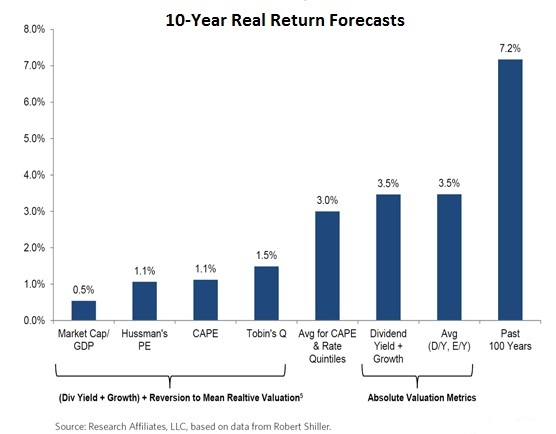
To be sure, an astute observer would proclaim that the path to 4% annualized between June of 2016 and June of 2026 tells us very little about when a bear market will transpire. On the flip side, market-cap-to-GDP as well as a wide variety of venerable valuation methodologies also anticipate anemic 10-year returns. And history regularly shows that listless 10-year rolling results often include one or more bear maulings along the way.
None of the data may be relevant to a devout buy-n-holder. For one thing, you may be comforted by 3%, 4% or 5% over the coming decade. Similarly, you may simply feel that you would be unskilled with respect to identifying the right time to reduce stock exposure and the right time to add stock exposure.
From my vantage point, however, the judicious course right now is to reduce one’s overall percentage exposure to stock as well as one’s exposure to riskier types of stock. Perhaps a moderate growth investor reduces 70% diversified stock (e.g., large, small, foreign, emerging, etc.) to 45% high quality large-cap stock. You do so because the reward of maintaining the higher allocation across the stock landscape is not worth the risk of a fire decimating the bulk of your portfolio. I prefer ETFs like iShares MSCI Quality Factor (NYSE:QUAL), ProShares S&P 500 Aristocrats (NYSE:NOBL), PowerShares S&P High Quality (NYSE:SPHQ) and/or Vanguard Dividend Growth (NYSE:VIG).
There’s another reason why a tactical downshift today is sensible: Cash on hand. Having a 25%-33% cash buffer when valuations are hitting extremes and/or when the percentage of household financial assets invested in equities becomes excessive provides a measure of comfort during bouts of volatility. Cash also gives one the flexibility to reacquire “risk-on” assets at more favorable prices. (Note: You don’t have to be perfect with the “timing” either.)
Consider, once again, the household equity percentage chart above. When the percentage of household financial assets invested in stocks was an exceptionally modest 30%-35% between 1975 and 1990, the forward 10-year total returns annualized at rates between 14% and 18%. 14%-18% annualized growth!
In other words, when household allocations to stock are at fretfully low levels, perhaps because bearish price depreciation pushed households out of stocks, you will have the cash on hand to snap up bargains. Low-yielding cash does not have to keep up with inflation; it does not need to maintain your purchasing power. It just needs to be redeployed when valuations (or household equity percentages) are far more favorable.
Disclosure: Gary Gordon, MS, CFP is the president of Pacific Park Financial, Inc., a Registered Investment Adviser with the SEC. Gary Gordon, Pacific Park Financial, Inc, and/or its clients June hold positions in the ETFs, mutual funds, and/or any investment asset mentioned above. The commentary does not constitute individualized investment advice. The opinions offered herein are not personalized recommendations to buy, sell or hold securities. At times, issuers of exchange-traded products compensate Pacific Park Financial, Inc. or its subsidiaries for advertising at the ETF Expert web site. ETF Expert content is created independently of any advertising relationships.


