One way to gauge the well-being of stock assets is to examine all of the 1900-plus stocks listed on the New York Stock Exchange. We can do this by evaluating the progress of the NYSE Composite Index.
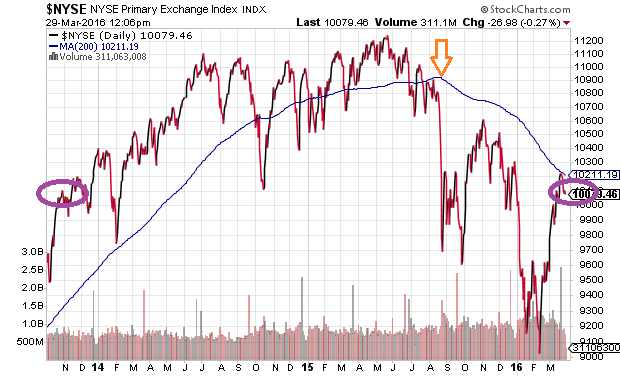
The first item worth noting is that stock assets have struggled to make any progress since late October of 2013 – the index has failed to maintain any price appreciation in nearly two-and-a-half years. The second observation? The NYSE Composite peaked at about the same time as the Dow Jones Industrials (DJI) and S&P 500. It follows that the bull market may have ended on May 21, 2015. Indeed, it has been more than 10 months since a wide range of stocks collectively hit record highs.
The third item worthy of discussion is the reality that the slope of the NYSE’s 200-day moving average has been negative since August of 2015. The turning point represents a technical shift from uptrend to downtrend. Moreover, until a new uptrend materializes, price volatility is likely to remain and stock gains are unlikely to last.
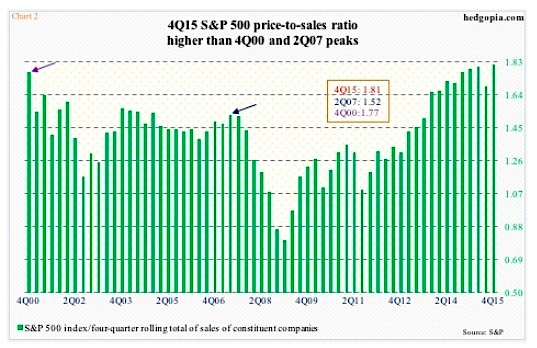
Price movement alone is not the only headwind for stocks. Extreme valuations present a challenge as well. For example, the price-to-sales (P/S) for the S&P 500 by Q4 2015 had approached 1.8. Stocks prices relative to corporate revenue were not this high before the financial collapse. The only other time that stock prices relative to sales at public corporations were this lofty? 2000 – right before the dot-com collapse.
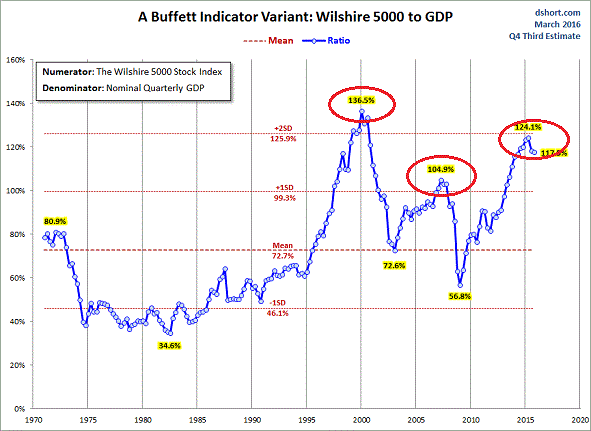
In truth, it does not matter which method of traditional stock valuation that one employs. Price-to-earnings – forward, current, and cyclically-adjusted P/E 10 – all place stocks at the higher end of exorbitant. Market-cap-to-GDP or market-cap-to-GNP both demonstrate that stocks are pricier than the 2007 top and only surpassed by the the 2000 New Economy insanity. (See chart below.)
What’s more, the tiresome low interest rate argument that supposedly makes stocks “the only game in town,” has been debunked by similar periods of ultra-low rates (i.e., 1936-1955) as well as the ongoing demand for safe haven assets throughout the current Feb-March rally.
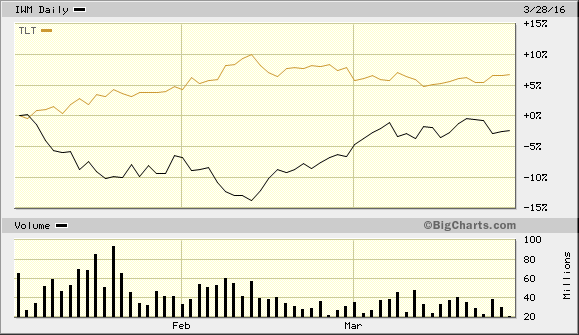
Granted, unfavorable technicals and undesirable fundamentals seem to play little part in the minds of perma-bulls. They point to the recovery that has brought the S&P 500 back to flat on the year. Yet since 2016 started, corporate profit estimates have cratered, Treasury bonds have outperformed equities and stocks outside the S&P 500 have lagged significantly. Small cap stocks via Russell 2000 (iShares Russell 2000 ETF (NYSE:IWM)) are still down in 2016. Meanwhile, iShares 20+ Year Treasury Bond (NYSE:TLT) has been one of the top performers.
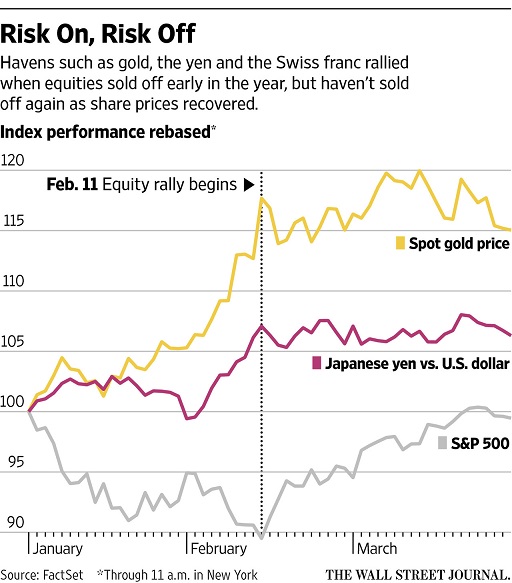
For all the hype about the extraordinary risk-on rally for stocks since the February 11 lows, few seem to be talking about the enduring appeal of safe havens like the SPDR Trust Gold ETF (NYSE:GLD), the CurrencyShares Yen Trust Fund(NYSE:FXY) and the CurrencyShares Swiss Franc Fund (NYSE:FXF). The Wall Street Journal recently demonstrated that investors fled to a variety of safe haven assets in January and early February, such as gold, the yen and the Swiss franc.
In a true risk-on rally, these assets would typically lose their appeal. Yet all three of them remain elevated when you look at where they started the year, where they were at the February 11 stock lows and at the end of March.
Is it possible that the Federal Reserve and Janet Yellen can offer up enough happy talk about accommodating monetary policy? Reducing rate hikes from four down to two was a start.
On the other hand, absent the shock-n-awe associated with quantitative easing (QE) endeavors, investors are likely to shy away from the drag of the earnings recession. Profits are 18.5% lower than they were at the Q3 2014 peak, yet prices are trading at the same levels as they did at the end of Q3 2014. They were expensive then. They are far more expensive now. And if they move much higher, only a magical turnaround in corporate profits could justify the price gains.
Disclosure: Gary Gordon, MS, CFP is the president of Pacific Park Financial, Inc., a Registered Investment Adviser with the SEC. Gary Gordon, Pacific Park Financial, Inc, and/or its clients may hold positions in the ETFs, mutual funds, and/or any investment asset mentioned above. The commentary does not constitute individualized investment advice. The opinions offered herein are not personalized recommendations to buy, sell or hold securities. At times, issuers of exchange-traded products compensate Pacific Park Financial, Inc. or its subsidiaries for advertising at the ETF Expert web site. ETF Expert content is created independently of any advertising relationships.
