
Risk appetite deteriorated during the U..S session yesterday, and the Asian trading today, despite the Fed’s announcement that it would broaden the ability of other central banks to exchange their holdings of U.S. Treasuries for overnight dollar loans. The switch back to risk-off at the turn of the quarter enhances our view not to trust a long-lasting recovery in the broader investor morale. As for the data, Eurozone’s inflation slowed in March while BoJ’s Tankan survey suggested contraction in Q1, which increase the chances for more stimulus by the ECB and the BoJ.
CORONAVIRUS NEW DEATHS AND CASES HIT NEW RECORDS
The dollar traded mixed against the other G10 currencies on Tuesday and during the Asian morning Wednesday. It gained against NZD, AUD and slightly against CHF, while it underperformed versus SEK, NOK, CAD, JPY and GBP in that order. The greenback was found virtually unchanged against EUR.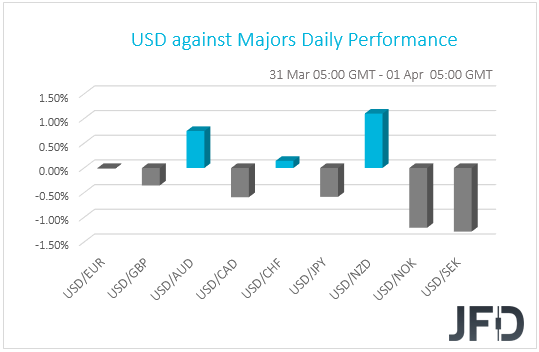
The weakening of the risk-linked currencies Aussie and Kiwi, combined with the strengthening of the safe-haven yen, suggests that the first quarter of 2020 closed with a risk-off flavor. Looking at equities, we see that EU indices continued to gain, perhaps due to investors rebalancing their portfolios. Remember, yesterday we noted that those who sold stocks heavily due to the fast spreading of the coronavirus may have been buying back some, which they believe they’ve become cheap enough. However, the picture was different during the US and Asian sessions, despite the Fed’s announcement that it would broaden the ability of other central banks to exchange their holdings of US Treasuries for overnight dollar loans. All three of Wall Street’s main indices closed in negative waters, with the risk aversion rolling into the Asian session today. At the time of writing, Japan’s Nikkei, China’s Shanghai Composite and Hong Kong’s Hang Seng are down 4.44%, 0.32% and 2.39% respectively.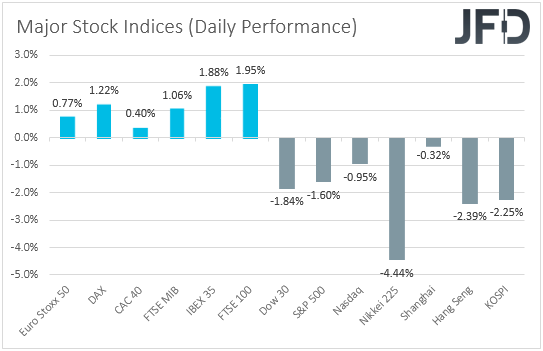
The switch back to risk-off at the turn of the quarter enhances our view not to trust a long-lasting recovery in the broader investor morale. New infected cases and deaths due to the coronavirus have hit new records yesterday, suggesting that the worst is not behind us yet. The lockdown in most nations around the globe may last longer than previously anticipated, which may deepen the economic wounds. In our view, it would be naïve to assume that the virus saga is already priced in. Thus, we repeat for the umpteenth time that we see decent chances for equities to trade south and for safe-havens to shine again. The dollar could also put back its safe-haven suit, but we don’t expect it to strengthen at the pace it did recently, from March 9th until the 20th of the month. The reason for that is the Fed’s attempts to increase the supply of greenbacks around the globe in order to support the smooth functioning of the financial markets.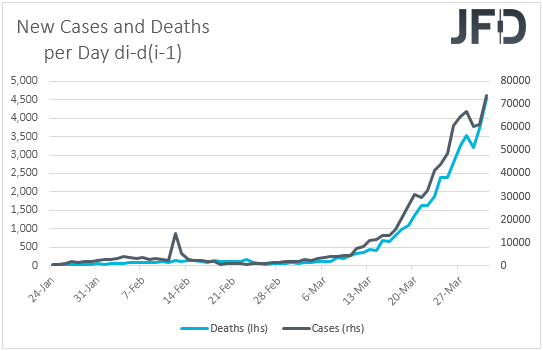
AUD/JPY – TECHNICAL OUTLOOK
AUD/JPY traded lower yesterday, after it hit resistance near the 67.25 level. At the time of writing, the pair is hovering slightly above 65.55, a support marked by last Thursday’s low. Overall, the pair has been oscillating between 65.00 and 67.70 since March 24th, and thus, we will adopt a neutral stance for now.
In order to start examining the case of larger declines, we would like to see a decisive dip below the lower end of the aforementioned range, at 65.00. Something like that may wake up the bears, who could drive the battle towards the low of March 23rd, near 62.85. If they manage to overcome that hurdle as well, then we could see them aiming for the psychological round number of 60.00, which is also near the low of March 19th.
On the upside, we would prefer to wait for a break above 67.70 before we start examining whether the bulls have gained the upper hand. This may signal the upside exit out of the short-term range and may initially pave the way towards the 69.00 barrier, marked by the highs of March 9th and 10th, or the 69.50 zone, near the low of March 6th. Another break, above 69.50, may encourage the bulls to climb towards the 71.45 obstacle, which provided decent resistance on March 3rd, 4th, and 5th.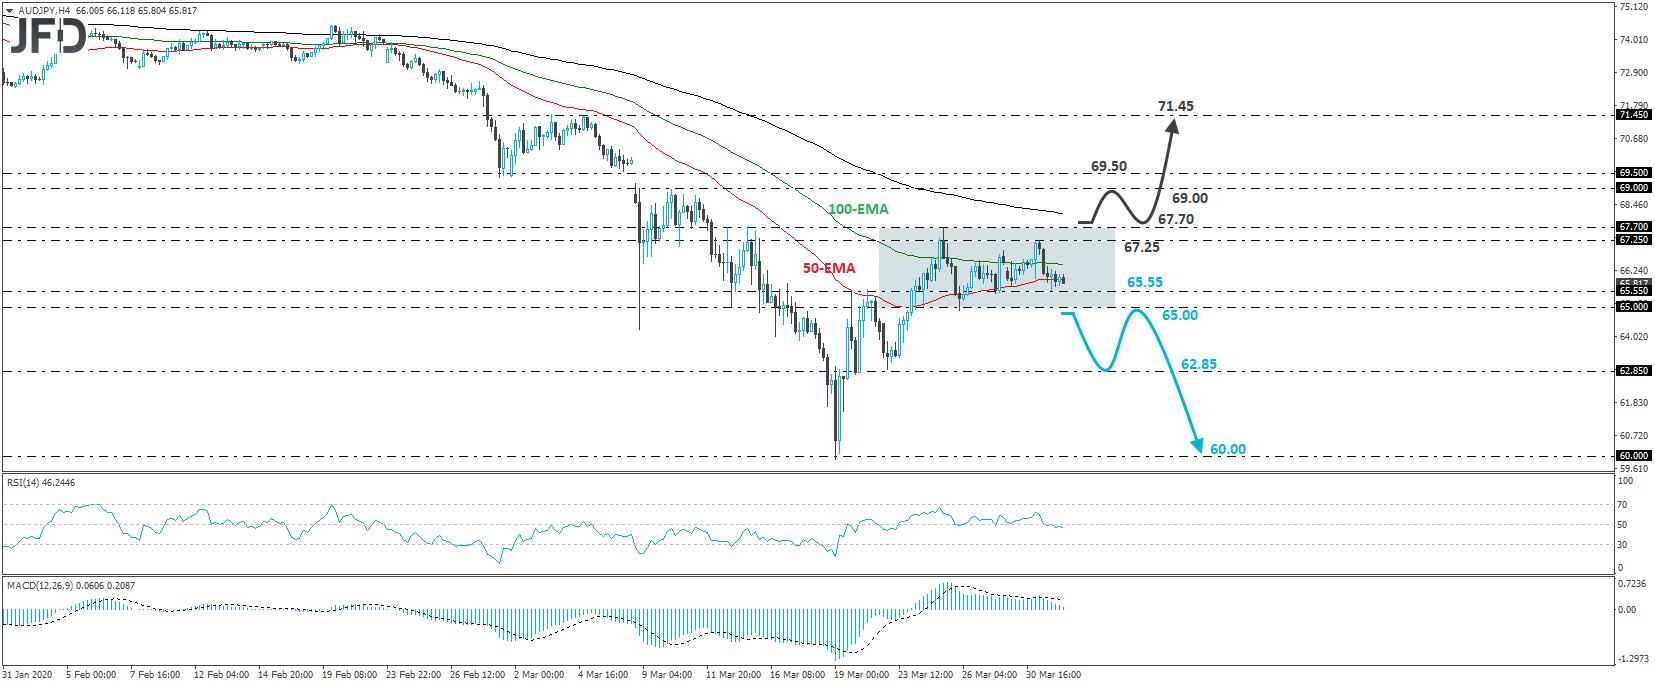
EUROZONE INFLATION SLOWS, JAPAN’S TANKAN SIGNALS CONTRACTION
As for the data, yesterday we got Eurozone’s preliminary CPIs for March. The headline rate slid more than anticipated, to +0.7% yoy from +1.2%, while the forecast was for a decline to +0.8%. The core rate slid as well, to +1.0% from +1.2%. No forecast was available for the core print.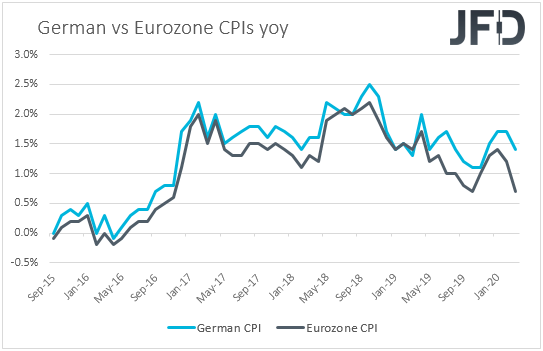
The euro drifted somewhat lower in the aftermath of the release, perhaps as the data increased speculation for more easing by the ECB, or it could also be due to a broader dollar strength during the European session yesterday. On March 23rd, Governing Council member Ignazio Visco said that the adopted measures are sufficient and effective but he and his colleagues stand ready to do more if necessary. So, having that in mind, as well as the disappointing PMIs for March, slowing inflation may indeed have increased the chances for further stimulus. Officials may decide to increase the size of their bond purchases or even cut the deposit rate further into the negative territory. Although the former appears more likely, with the Bank’s Chief, Christine Lagarde, saying “There are no limits to our commitment to the euro”, we cannot totally rule out the latter.
Overnight, the BoJ released its Tankan survey for Q1. Both the large manufacturers and non-manufacturers indices fell into negative territory, suggesting that economic activity may have shrunk during the first three months of 2020. Following the contraction in Q4 2019, this increases notably the chances for a technical recession in the world’s third largest economy and enhances the case for more stimulus by the BoJ.
EUR/JPY – TECHNICAL OUTLOOK
EUR/JPY traded south during the Asian morning today, after it hit resistance near the 118.85 territory. Overall, the rate is printing lower highs and lower lows below a downside resistance line drawn from the high of March 26th, but also above an upside line, taken from the low of March 9th. Having in mind that the pair remains stuck between those two lines, we will stand pat for now and wait for a decisive directional break.
A clear dip below 118.20 may signal the break below the upside line and could initially target the low of March 23rd, at around 117.75. If the bears are not willing to stop there, a move lower could see scope for extensions towards the 117.30 area. Another break, below 117.30, could carry more bearish implications, perhaps setting the stage for the low of March 18th, at around 116.90.
In order to start examining the bullish case, we would like to see a rebound above today’s peak of 118.85. This may confirm the break above the downside line and could open the path towards yesterday’s high, near 119.70. If the bulls are strong enough to overcome that zone, then we may see them putting the 120.35 zone on their radars. That zone is marked as a resistance by an intraday swing high formed on March 27th.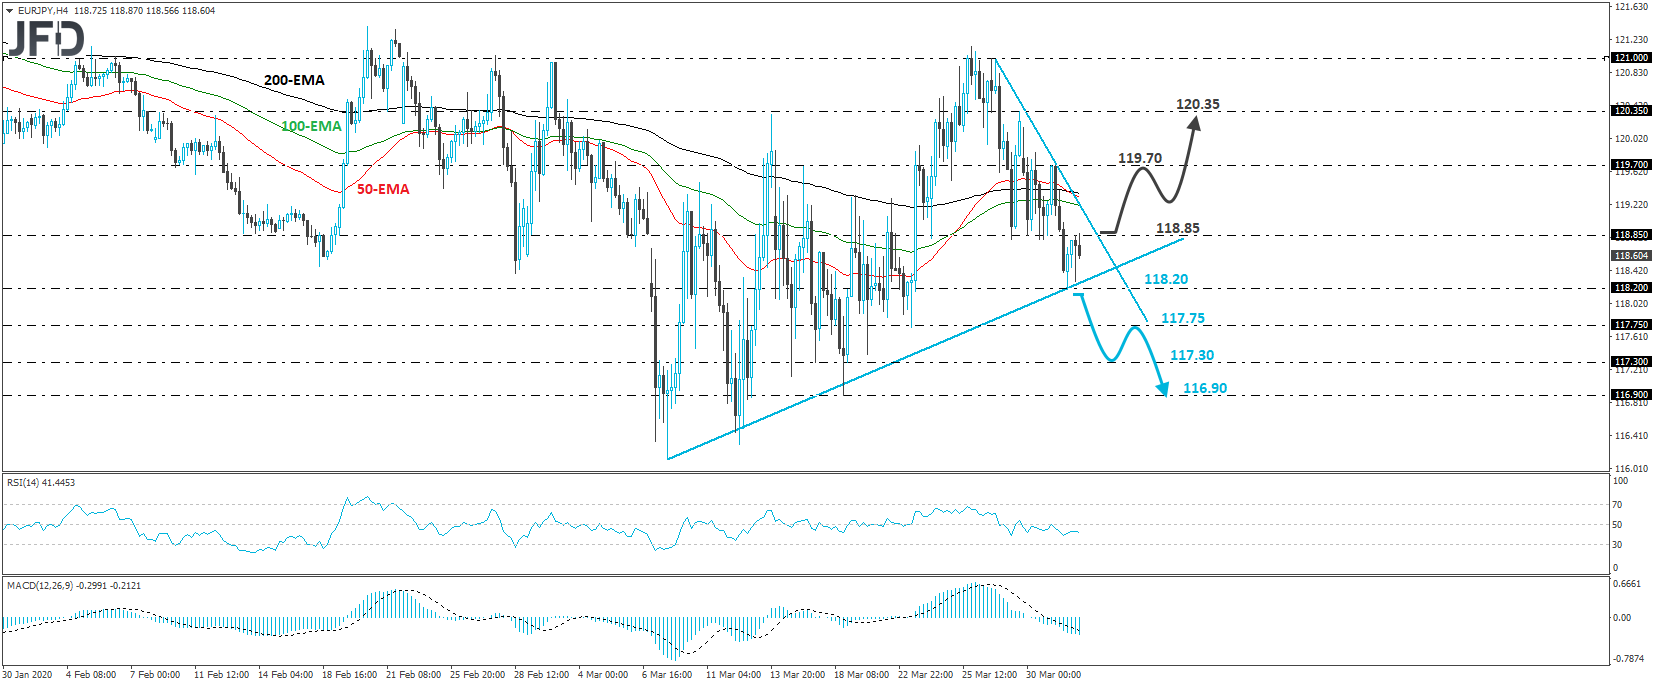
AS FOR TODAY’S EVENTS
We get the final Markit PMIs from the Eurozone, the UK and the US, but as it is usually the case, expectations are for confirmations of the initial estimates. Investors may pay more attention to the US ISM index for the month, which is expected to have declined to 45.0 from 50.1.
In the US, the ADP (NASDAQ:ADP) employment report for March is also coming out. Expectations are for a decline of 154k following a 183k increase in February. Coming on top of the astonishing surge in initial jobless claims for the week ended on March 14th, this could raise speculation that the NFPs, due out on Friday, may also reveal a tumble.
With regards to the energy market, we get the EIA (Energy Information Administration) report on crude oil inventories for last week. Expectations are for a 4mn barrels inventory build following a 1.6mn increase the week before. That said, bearing in mind that, overnight, the API (American Petroleum Institute) reported a 10.5mn barrels increase, we see the risks surrounding the EIA forecast as tilted to the upside. If this is the case, both WTI and Brent prices could trade lower.
- English (UK)
- English (India)
- English (Canada)
- English (Australia)
- English (South Africa)
- English (Philippines)
- English (Nigeria)
- Deutsch
- Español (España)
- Español (México)
- Français
- Italiano
- Nederlands
- Português (Portugal)
- Polski
- Português (Brasil)
- Русский
- Türkçe
- العربية
- Ελληνικά
- Svenska
- Suomi
- עברית
- 日本語
- 한국어
- 简体中文
- 繁體中文
- Bahasa Indonesia
- Bahasa Melayu
- ไทย
- Tiếng Việt
- हिंदी
Coronavirus Continues to Spread At A Fast Pace
Published 04/01/2020, 03:27 AM
Updated 07/09/2023, 06:31 AM
Coronavirus Continues to Spread At A Fast Pace
3rd party Ad. Not an offer or recommendation by Investing.com. See disclosure here or
remove ads
.
Latest comments
Install Our App
Risk Disclosure: Trading in financial instruments and/or cryptocurrencies involves high risks including the risk of losing some, or all, of your investment amount, and may not be suitable for all investors. Prices of cryptocurrencies are extremely volatile and may be affected by external factors such as financial, regulatory or political events. Trading on margin increases the financial risks.
Before deciding to trade in financial instrument or cryptocurrencies you should be fully informed of the risks and costs associated with trading the financial markets, carefully consider your investment objectives, level of experience, and risk appetite, and seek professional advice where needed.
Fusion Media would like to remind you that the data contained in this website is not necessarily real-time nor accurate. The data and prices on the website are not necessarily provided by any market or exchange, but may be provided by market makers, and so prices may not be accurate and may differ from the actual price at any given market, meaning prices are indicative and not appropriate for trading purposes. Fusion Media and any provider of the data contained in this website will not accept liability for any loss or damage as a result of your trading, or your reliance on the information contained within this website.
It is prohibited to use, store, reproduce, display, modify, transmit or distribute the data contained in this website without the explicit prior written permission of Fusion Media and/or the data provider. All intellectual property rights are reserved by the providers and/or the exchange providing the data contained in this website.
Fusion Media may be compensated by the advertisers that appear on the website, based on your interaction with the advertisements or advertisers.
© 2007-2024 - Fusion Media Limited. All Rights Reserved.