Forex News and Events:
North America Recap
The US economy added 217’000 new nonfarm jobs in May (vs. 215K exp. & 288K last), the unemployment and the participation rates remained stable at 6.3% and 66.1% respectively, the average earnings increased at the faster pace of 2.1% y/y (vs. 2.0% exp. & 0.0% last). The 10-year US government yields spiked to 2.5986% while the USD came into demand with little follow through in USD purchases. The EM risk rally took over the pre-weekend session in New York. EUR/USD rallied to 1.3677 post-NFPs in New York but has since failed to move higher. In Canada, the full time employment decreased by 29.1K, while part-time jobs saw 54.9K increase in May. The unemployment rate deteriorated from 6.9% to 7.0%. We keep our CAD-bearish view and look for opportunities to jump on USD/CAD rallies as long as the 1.0804 fibonacci support holds. With central banks now moving on the offense against disinflationary risk, headed by the BoJ and ECB we could see more central banks joining the accommodation strategy. This should equal less volatility (FX and equities) and aggressive yield seeking behavior. Currencies such as CHFand SEK to which deflation poises a direct threat should come under selling pressure, while AUD with a more hawkish RBA (25bp hike expected this week) should appreciate. In this subdued summer trading environment, the primary concern is a sudden spike in volatility (escalation tensions in Ukraine) or significantly shift in flow due to rally in US yields. CFTC IMM CTA data showed that USD long positions are now at the highest level since March and net short EUR and JPY positions have increased.
Japan GDP
Business spending surprised, rising 7.6% while consumer spending was in line at 2.2% q/q. In addition, Japan’s BoP current account surplus expanded to ¥187.4bn in April, but less than the expected surplus of ¥287.7bn. Japan’s Health Minister Tamura, halted speculation on GPIF’s presumed increase in activity through stock markets. The PM Abe ordered an earlier revision of Japan’s largest pension fund GPIF’s portfolio, said Tamura, yet no concrete action has been taken yet. We suspect those Japanese pensions funds are already investing in stock markets given the significant outperformance of domestic stocks. In fact, the TOPIX index gained more than 100 pts after hitting the 2014-low by mid-April; the Nikkei index surged almost by 10% over the same period. The Japanese government is expected to introduce reforms on GPIF governance this month, to adjust the risk of its investment strategy to the current market conditions. Given that the expectations on higher inflation dynamics are expected to enhance appetite in foreign stock and bond markets, the capital outflows should continue weighing on the yen. However, the Japanese reluctance to invest abroad reduces the selling pressures in JPY.
BRL in Demand
With the US economic data continuing to improve, the ECB heading towards an extended period of monetary accommodation and volatility at low levels, FX should be prepared for carry trades to improve. CFTC IMM CTA data showed that USD long positions are now at the highest level since March and net short EUR and JPY positions have increased. In this environment, short USD/BRL remains one of our favorite carry fueled trades (see Weekly Report - World Cup FX Rally). On the carry trading strategies, the real sees decent demand against yen on delightful combination of tighter BCB policy (high rates) and profitable risk rally in EM currencies (high BRL). While the Brazil Central Bank support to BRL might be coming to its end, the policy rates are not ready to step down towards the end of the Fed’s QE exit. We see interesting long carry opportunities here.

Today's Key Issues (time in GMT):
2014-06-09T06:30:00 SEK SEB House Price Indicator2014-06-09T07:00:00 AUD RBA's Stevens Speech Text in San Francisco
2014-06-09T07:30:00 SEK Apr Household Consumption (MoM), last 0.60%, rev 0.80%
2014-06-09T07:30:00 SEK Apr Household Consumption (YoY), last 2.70%, rev 2.80%
2014-06-09T07:30:00 SEK May Budget Balance, last 11.1B
2014-06-09T08:30:00 GBP May Lloyds Employment Confidence, last 1
2014-06-09T08:30:00 EUR Jun Sentix Investor Confidence, exp 13.3, last 12.8
2014-06-09T12:15:00 CAD May Housing Starts, exp 185.0K, last 194.8K, rev 195.3K
2014-06-09T14:00:00 CAD 06.juin Bloomberg Nanos Confidence, last 60
2014-06-09T20:00:00 NZD 3Q Manpower Survey, last 29%
The Risk Today:
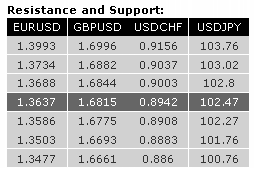
EUR/USD: EUR/USD has improved, breaking out of its short-term declining channel. Monitor the resistance at 1.3820 (see also 50% retracement). Hourly supports now lie at 1.3734 (intraday low) and 1.3673. Another resistance level can be found at 1.3876. In the longer term, EUR/USD is still in a succession of higher highs and higher lows. However, the recent marginal new highs (suggesting a potential long-term rising wedge) indicate an exhausted rise. As a result, we would favour selling short-term overextended rallies. A significant resistance now lies at 1.3876 (24/03/2014 high).
GBP/USD: GBP/USD rose sharply higher yesterday, breaking the resistances at 1.6684 and 1.6718 (see also the declining trendline). Resistances can now be found at 1.6786 and 1.6823. The short-term bullish momentum is intact as long as the hourly support at 1.6684 (previous resistance) holds. Another support lies at 1.6556. In the longer term, prices continue to move in a rising channel. As a result, a bullish bias remains favoured as long as the support at 1.6460 holds. A major resistance stands at 1.7043 (05/08/2009 high)
USD/JPY: USD/JPY has broken the support at 102.68 (19/03/2014 high), leading to a sharp decline. Even though the support at 101.72 has been breached, prices are now close to a key support between 101.56 (see the rising trendline from 100.76 (04/02/2014 low)) and 100.76 (see also the 200 day moving average). A resistance now stands at 102.68 (previous support). A long-term bullish bias is favoured as long as the key support area given by the 200 day moving average (around 100.80) and 99.57 (see also the rising trendline from the 93.79 low (13/06/2013)) holds. A major resistance stands at 110.66 (15/08/2008 high).
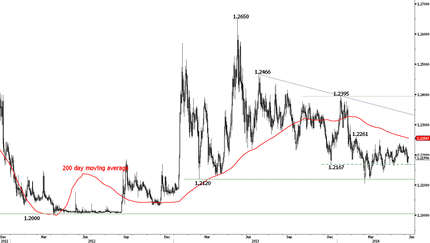
USD/CHF: USD/CHF has thus far failed to decisively break the key resistance at 0.8930. The weakening momentum has been confirmed by the break of the support implied by the rising trendline. Other hourly horizontal supports stand at 0.8814 and 0.8787. Hourly resistances can be found at 0.8887 (intraday high) and 0.8953. From a longer term perspective, the structure present since 0.9972 (24/07/2012) is seen as a large corrective phase. The recent technical improvements suggest weakening selling pressures and a potential base formation. A decisive break of the key resistance at 0.8930 would open the way for further medium-term strength.

