- All Instrument Types
- Indices
- Equities
- ETFs
- Funds
- Commodities
- Currencies
- Crypto
- Bonds
- Certificates
Please try another search

Is Gold Attractive Again?

We've oft put forth the premise that "change is an illusion" whereas "price is the truth". To be sure, the trader's very survival is primarily attributed to change, for 'tis his very stock in trade. But when it comes to an asset's valuation, price is everything, especially with regard to where 'twill be in the future.
Gold is now around 1319, which is +12% above last year's low of 1179, an impressive seven-month change for a market by any means, (especially given the US Treasury's current six-month T-Bill yield of 0.7%). Of course, those who bagged the S&P for the entirety of 2013 gained +30%, albeit it remains to be seen who'll be left holding the bag when it all goes wrong. But specific to Gold, 'tis heartening at least by this writing to note that its price no longer commences with "11" or "12" but rather with "13".
In fact, rare as 'tis for Gold to get media attention when it rises, the FinTimes noted on Friday that "Gold shines on back of dollar weakness...US currency drops close to lowest levels of 2014." The Dollar Index settled Friday at 80.2 (as measured to the nearest tenth). What is the average price of Gold since 2007 for the 25 days when the Dollar Index has settled at that rounded 80.2? 1307. I judge such proximity to Saturday's 1319 as purely coincidental because the standard deviation of that average is excessive, (therefore keeping us mindful that at the end of the day, Gold plays no currency favourites). Still, despite prior FinMedia proclamations of Dollar strength, two missives ago 'twas herein demonstrated that the Buck's broader-based trend is indeed down. And as a Gold focus, further Dollar demise almost certainly, if not naturally, means higher Gold levels, (although we know 'tis not a necessity).
Moreover -- and I perfectly understand that the point in time and price from which one measures is critical -- let's comb back 44 editions to The Gold Update of 13 April 2013 when price had just plunged better than 100 points in a week to then sit at 1476. Quote: "...had Gold kept pace with the growth in M2, ‘twould rightly be currently priced in the low 1800s..."
Since that date, StateSide M2 alone has increased from $10.55 trillion to $11.08 trillion today, (or $530 billion). Regressing the price of Gold to M2 from the beginning of the Fed's Quantitative Easing in late 2008 through Gold's all-time closing weekly high in 2011 gives us a rate of $731/oz. per $1 trillion of M2. Thus from 1476 in ending that fateful week last April, given the one-half trillion dollar increase since then in M2, Gold today "ought be" 1863. And that obviously is conservative, (i.e. had Gold kept that pace with M2 throughout, 'twould already be well north of 2000 -- and that excludes other fiat debasings even being accounted for in such analysis).
The point is: one might be all excited about the recent change in the price of Gold; but its price now only beginning with "13" remains vastly low. In any event, on to the promising weekly bars chart we go:
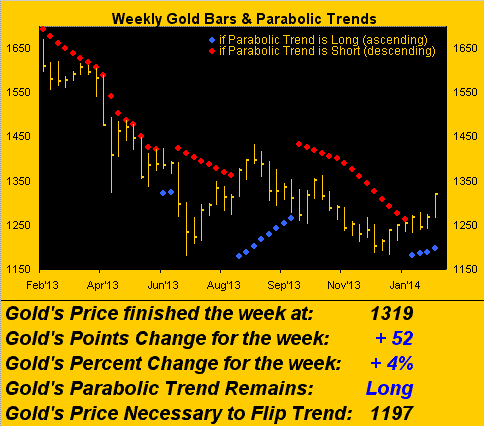
'Twas Gold's best percentage weekly gain since that ending 16 August and the third best in more than two years. In fact, Gold's recent rally now places it just 90 points away from the declining 300-day moving average, presented below logarithmically so as to keep the Gold illiterates at bay. Perspective at its best:
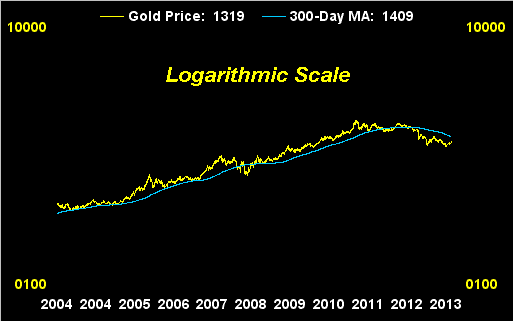
Indeed the logarithmic look really makes the last two years appear as nothing more than a lull in the action. Moreover: through the 31 trading sessions year-to-date, Gold and its 300-day moving average are converging toward each other at a pace of almost five points per day, which if maintained would place price above average in a month's time.
And isn't it curious in tandem with the S&P's sudden return to glory that Gold, instead of plunging as has been its reactive wont, instead has continued higher with gusto as well? It reminds me of tennis' Victoria "Vika" Azarenka's winning match point to take her first Australian Open singles title back in 2012, then dropping to the ground in wide-eyed disbelief exclaiming "What just happened?"
Late in last Tuesday's trading session whilst all the lemmings were celebrating a benevolently squishy testimony by Fed Chair Yellen to the House Committee on Financial Services, I noticed something most curious: despite the S&P's zooming well back above 1800, Gold nonetheless was closing in on surmounting 1300 -- even though the Bond was going down; and even though the EuroCurrencies were going down. "What just happened?" indeed.
Answer: as herein waxed upon a week ago, Gold "knows". And astute investors who've been on its fringe are beginning to sense that Gold really is quite the attractive value down here regardless of any correlative stance to the essentially Fed-supported S&P, such that sentiment has started to favourably shift toward a return to a far more proper market valuation for the yellow metal, and thus Gold is now really getting the bid. But as for the S&P, you know that for this young-year-to-date we've been on "crash watch" and so remain.
Specific to stocks which appear to have taken comfort that the Fed will always be there, ("taper-schmaper" as they continue to monetarily inject at a rate of $3 billion per workday), let's give the S&P its due: 'twas for 12 consecutive sessions what we term as "technically textbook oversold". That condition was unwound this past week, so much so that as of yesterday's close, 'tis now "technically textbook overbought". Talk about volatility, (to say nothing that the "live" p/e ratio is now 31.2x).
But heaven forbid the naïveté of the status quo be alerted. As long as the S&P trades generally near to, if not regularly make, new highs, all is financially normal such that we can instead focus on the Top-of-the-Hour national radio news stories pitched to us yesterday in the following order: 'tis mid-winter but for some reason 'tis snowing; that certain professional footballers are bullying one another; and that by law John is now eligible and indeed has opted to instead play on the girls' high-school golf team, (all three such top stories of course being related to global warming). Not much being reported out there about the seemingly "easy money" afforded by a 401k suddenly being deemed as "sorely lacking" upon retirement.
At the end of the day regardless of the misguided newsflow, the one thing that is perfectly consistent is its inconsistency all 'round. To wit during Ms. Yellen's testimony: "NASDAQ--Gold futures hold near 3-month high as Yellen comments support"; "REUTERS--Yellen stays the course, says Fed to keep trimming stimulus"
'Tis all so 180° out-of-phase! One day the economy's great, the next day 'tis not so great. You be the judge:
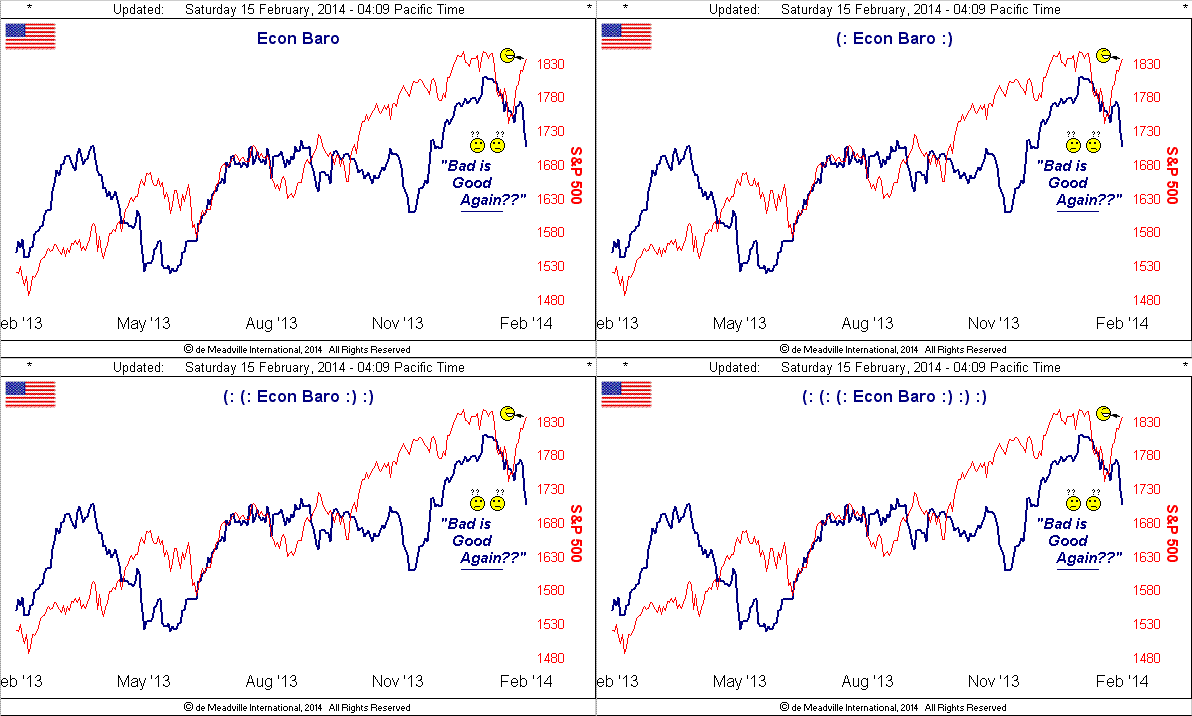
Indeed the past week included this montage of other financial headlines: "US economy may be stuck in slow lane for long run ... Two straight weak job reports have raised doubts about economists' predictions of breakout growth in 2014 ... The global economy is showing signs of slowing -- again." And the S&P just loves all that, right? For "tapering" notwithstanding, like hits on the radio, the dough just keeps on comin'!
But not everyone's piled back into the S&P in spite of its recent raucous rally. Here we've the Index's roller coaster ride (red line) on a points basis over the last 21 trading days, along with its Moneyflow (blue line) regressed into S&P points:
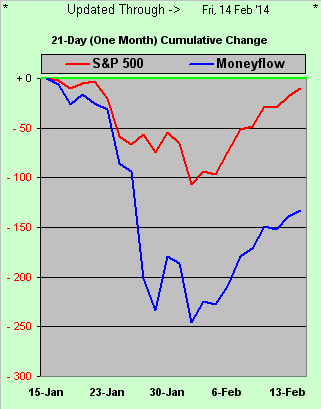
"Wow mmb, that's the opposite of what we saw when that moneyflow line was 100 points higher!"
Squire is correct. You might recall during last year when the S&P first eclipsed 1700 and we remarked how ridiculously high 'twas then, and yet at that time the Moneyflow suggested S&P levels of more than 100 points higher still, which came to fruition. Now the picture's upside down, so bear in mind moving forward both the state of the Econ Baro and the Moneyflow (!)
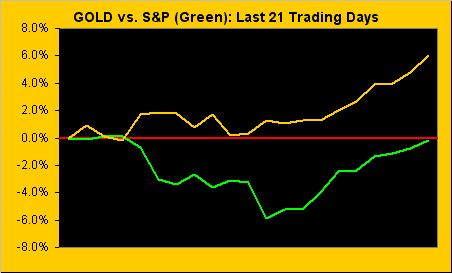
As noted earlier, Gold's correlation to the S&P, which has been practically in negative perfection these last two years, is now less so. Furthermore, my sense is that both markets are due for some imminent pullback, Gold just on a near-term basis, but the S&P on a far broader basis. To three such supportive charts:
First we've the percentage tracks of Gold versus the S&P from a month ago-to-date. Essentially 'tis been when the S&P goes down, Gold goes up -- and now when the S&P goes up, Gold still goes up:
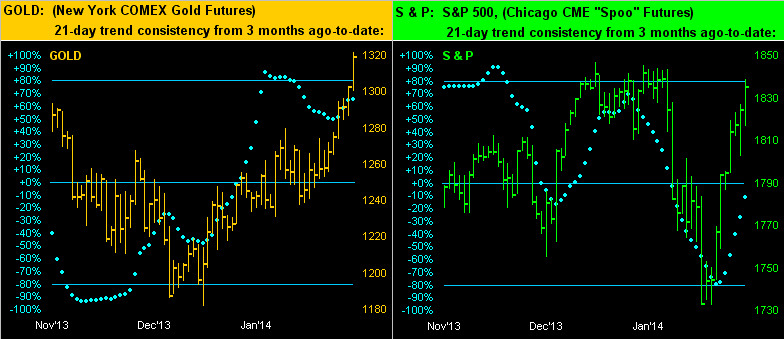
Second via their daily bars are the three months views and "Baby Blues" for both Gold and the S&P. The baby blue dots measure the 21-day linear regression trend ~consistency~ for each market. At left Gold's trend is clearly up and reinforcing itself as the dots turn higher. At right the S&P's trend, its recent rocket shot notwithstanding, is essentially flat as the dots are back to the 0% horizontal axis and price itself is back into the congested area established across the top-center portion of the chart:
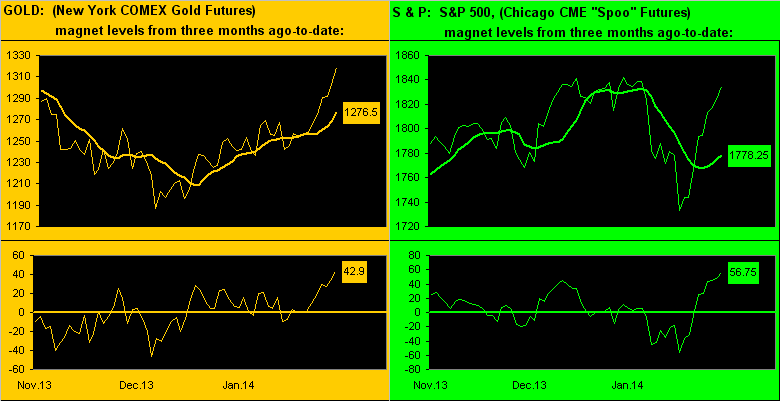
Third per our our Market Magnets from which price cannot too far stray, (hence the name), both Gold (below left) and the S&P (below right) appear in extremely high territory and thus our notion for some pullback. Again specific to Gold, we think any such pullback shall only be near-term:
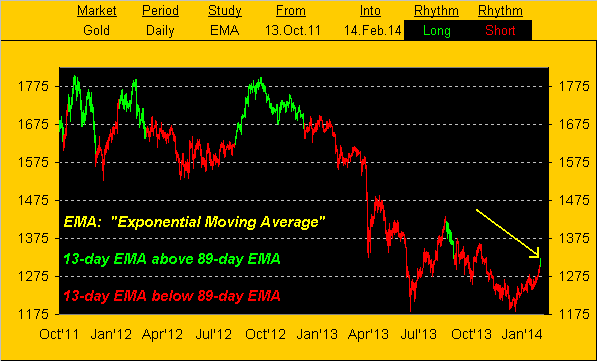
Here's why: this from our Department of Technical Delight, Market Rhythms Division. Of the four technical studies rigorously tested each day in seeking the BEGOS (Bond/Euro/Gold/Oil/S&P) markets' best trading rhythms, (i.e. repetitive ebb and flow, reflective of participation in and out), the rarest rhythms to which we are alerted come from EMA (exponential moving average) crossings, primarily because they maintain their dispositions to one another for weeks at a time. And for Gold, Friday's opening at 1302 confirmed the 13-day EMA as having crossed above the 89-day EMA.
Now before you go rollin' yer eyeballs at this seemingly esoteric excess, here's the important bit: in eight of the last ten EMA crossover confirmations (either positive or negative), price has followed through by at least 40 additional points in the same direction prior to the averages eventually crossing back opposite. Thus we place an 80% probability that this new positive crossing will lead Gold from the confirmation at 1302 + 40 to 1342 before the averages confirm their next negative cross. And with an eye to patience, EMA crossings do not necessarily lead to instant targets achieved: the data indicate it can take typically three-to-four weeks to reach the anticipated level, which in this case makes sense given our imminent expectations are for Gold to first endure some near-term traders' profit taking.
Either way, here are Gold's daily bars from better than two years ago-to-date: when they're green, the 13-day EMA is above the 89-day EMA, else red if vice-versa. And per the chart's arrow which points to Friday's price bar, again we exclaim, "What just happened?":
As to the degree of any near-term pullback, here is Gold's current trading profile indicative of dominant support apices at 1290, 1275, 1262 and 1259...
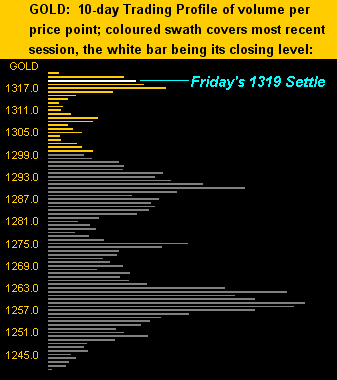
...from which we'll close it out for this week with the current state of the Gold Stack:
Gold’s All-Time High: 1923 (06 September 2011)
The Gateway to 2000: 1900+
The Final Frontier: 1800-1900
The Northern Front: 1750-1800
On Maneuvers: 1579-1750
The Floor: 1466-1579
Le Sous-sol: Sub-1466
The 300-day Moving Average: 1409
Base Camp:1377
Structural Resistance: 1322 / 1381 / 1479 / 1524-1535
Trading Resistance: (none)
Year-to-Date High: 1322 (right at initial structural resistance)
Gold Currently: 1319, (weighted-average trading range per day: 19 points)
Trading Support: 1317 / 1309 / 1290 / 1275 / 1262/ 1259 / 1250
Structural Support: 1279 / 1266 / 1249 / 1227 / 1163 / 1145
10-Session “volume-weighted” average price magnet: 1277, (directional range: 1240 up to 1322 = 82 points or +7%)
Year-to-Date Low: 1203
The Weekly Parabolic Price to flip Short: 1197
Finally, as if the markets weren't already zany enough so far this year, now we've this from one of my old haunts: "Barclays suffers sharp fall in profits ... Trading update reveals lower than expected results ... Barclays raises bonuses and cuts jobs ... Up to 12,000 jobs to be axed amid sharp drop in profit." The good news is that I'd long ago left them; the bad news is that I then teamed up with the French.


