Energy prices are feeling pressure from rising inventories and gloomy prospects of a U.S.-China trade deal this week. Metals are in limbo, awaiting any developments from the negotiations, while the agricultural sector is looking ahead to the latest World Agricultural Supply and Demand Estimates (WASDE) report from the US Department of Agriculture (USDA) due at noon EST on Thursday.
Energy
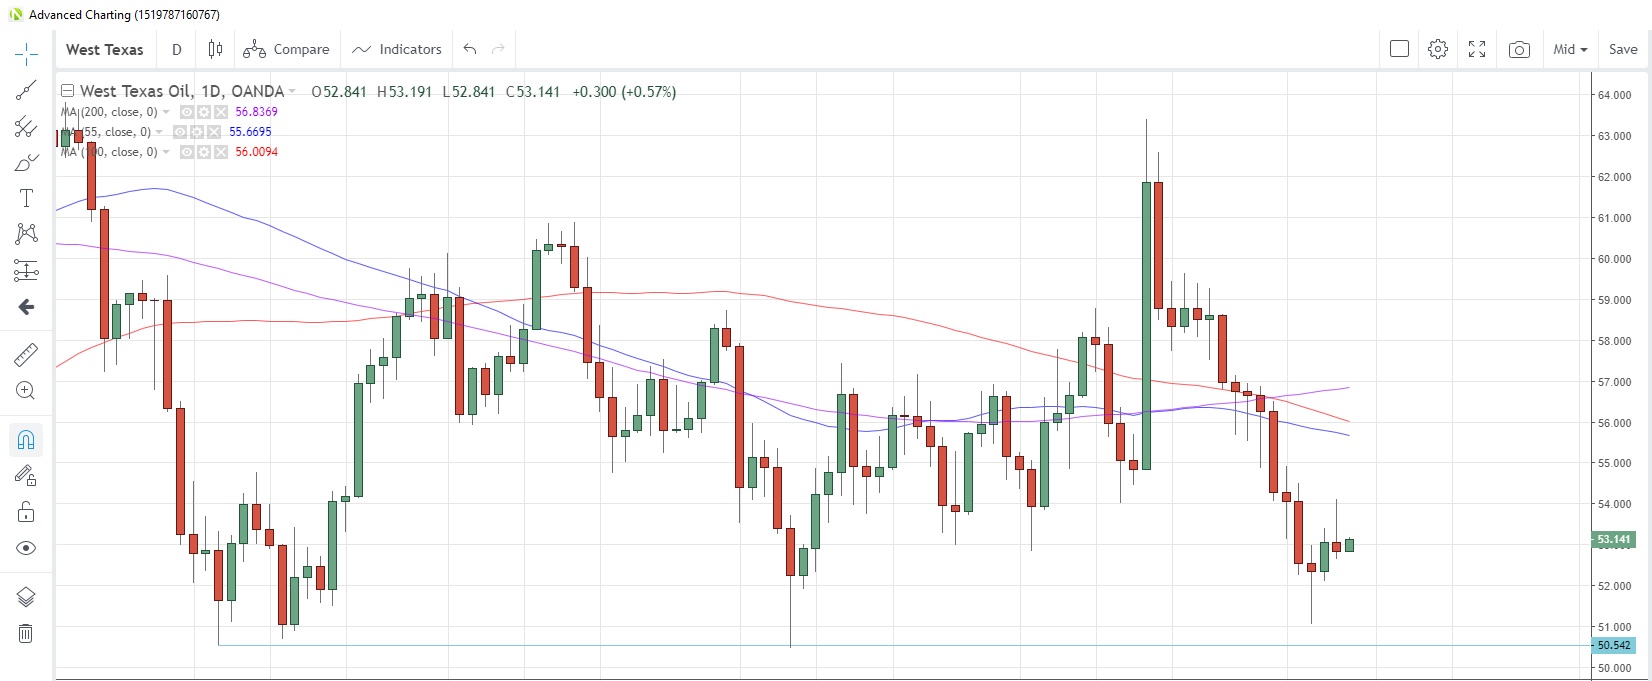
CRUDE OIL prices are hovering near 2-month lows after West Texas Intermediate (WTI) suffered the biggest weekly loss since July last week as U.S. data showed larger-than-expected increases in inventories. Dimming hopes for any major announcement of a U.S.-China trade deal this week are keeping prices under a bit of pressure, though they are showing some stability at lower levels.
In an effort to support prices, Nigeria announced yesterday that it and other OPEC members were ready to trim production further. Speculative investors scaled back net long positions for a third week in the week to Oct. 1, reducing net longs to the lowest in more than a month.
WTI Daily Chart

NATURAL GAS prices are being pushed around by a shift in temperature forecasts across the US from cooler to warmer. Prices slumped for a third straight week last week, hitting the lowest since end-August, and activity so far appears to be pushing prices lower for a fourth week. The 100-day moving average has capped prices on a closing basis for 1-1/2 weeks.
Inventory data from the Energy information Administration (EIA) showed an increase of 112 billion cubic feet (bcf) to September 27, the biggest weekly increase since June and well above the five-year average of 83 bcf.
However, speculative investors remain bullish on the commodity, boosting net long positions to the highest since the week of June 4 during the week to October 1, according to the latest data snapshot from CFTC.
Precious metals
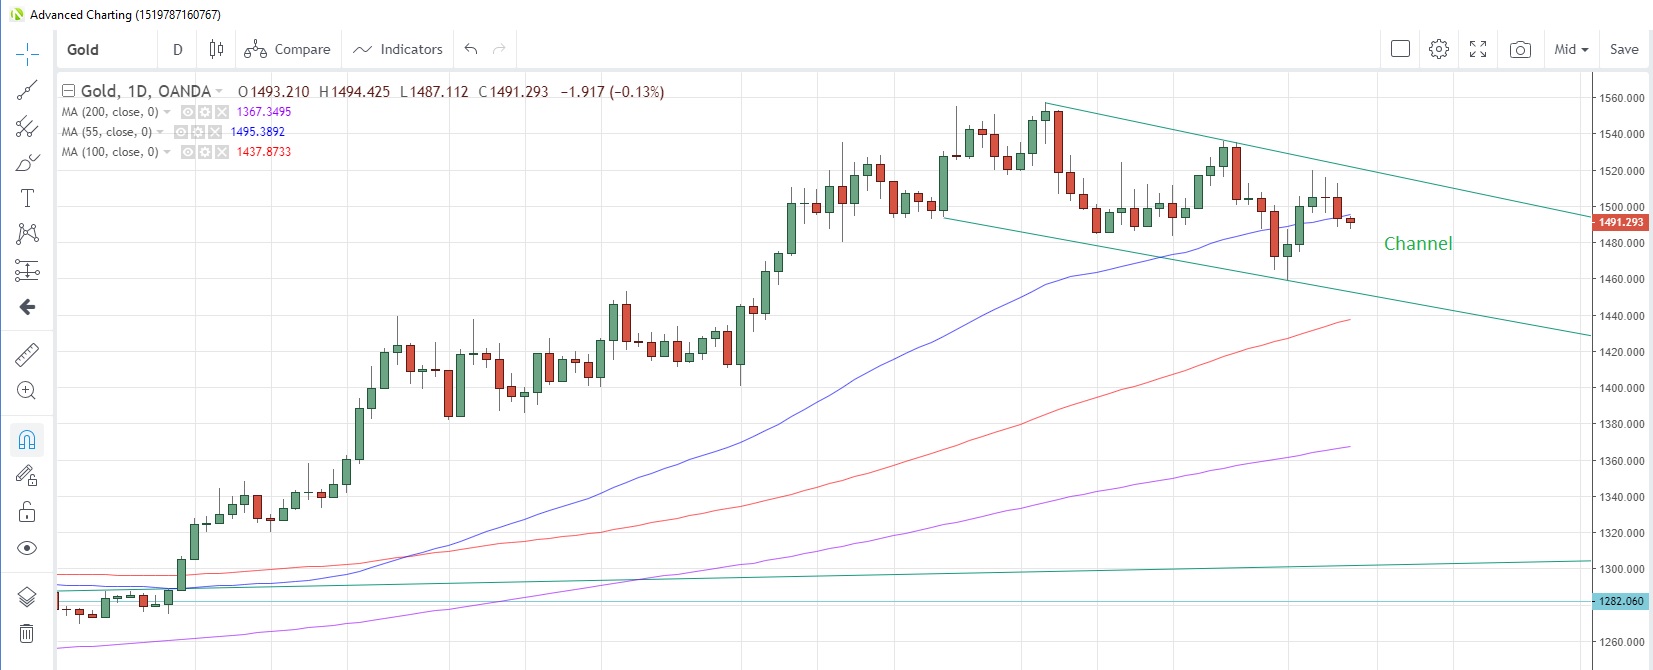
GOLD has been trading within the parameters of a downward sloping channel since end-August, as prices react accordingly to the ever-changing risk on/risk off scenarios. The upper and lower confines of that channel are at 1,521 and 1,453 respectively today.
China continued its gold purchases in September, adding 62.6 million ounces to reserves which brought total purchases during this buying spree, which started in December last year, to more than 100 million tons, according to Bloomberg reports yesterday. Since December 2018, gold prices have risen 22%. Speculation suggests that China may be diversifying some of its reserves out of the US dollar amid frosty trade negotiations with the US.
Speculative investors were net sellers of the precious metal in the week to October 1, according to the latest data snapshot from CFTC, reducing net long positions to the least since the week of July 30. Bloomberg reported yesterday that exchange-traded funds (ETFs) were net buyers of gold for a 15th consecutive day.
Gold Daily Chart

SILVER has been relatively stable over the past week, staging a minor recovery from the seven-week low struck at the start of this month. Speculative accounts trimmed net long positions for a fourth week and they are now at the lowest since August 20, according to the latest CFTC data.
The gold/silver (Mint) ratio has been struggling to sustain any breach of the 200-day moving average resistance at 86.18 this month after closing above it on September 30. The ratio is now at 85.477.
PLATINUM suffered the worst week since December 2017 last week, a victim of a firmer US dollar and a mixed outlook for future demand for the commodity. Prices touched the lowest in nearly six weeks last Wednesday but held above the 100-day moving average at 861.19, which has supported prices since August 21.
Speculative investors were net sellers in the week to October 1, pulling net long positions back from the highest in 19 months.
PALLADIUM has been in consolidation mode so far this month after touching a record high of 1,702.3 on September 30. Speculators are apparently still bullish on the commodity, increasing net long positions for a fifth straight week and boosting them to the highest since the week of July 30.
Base metals
Hopes for more concrete progress at this week’s US-China trade talks has lifted COPPER prices to the highest this month as they mount a challenge to the 55-day moving average at 2.5975, which has capped prices on a closing basis since September 16.
Speculative investors remain bearish on the industrial metal, increasing net short positions to the most in four weeks, according to the latest report from CFTC.
One of the world’s largest copper producers is facing a contractual dispute with supervisors at its flagship Los Pelambres mine in Chile. The company has requested government mediation after workers voted by majority to strike after rejecting a wage offer from the company. A potential strike is making investors wary of a disruption to future supply.
Agriculturals
SUGAR has been under pressure so far this week and looks set to snap a three-week rising streak. The bull-run has been supported by increased demand for sugarcane-based ethanol in Brazil and forecasts for slowing production in Thailand and Australia.
A recent report from the USDA’s Foreign Agricultural Service (FAS) forecast Thailand’s sugar production will fall in the next season starting December due to adverse weather conditions, while a separate report saw Australia’s second-largest export dropping to 4.5 million tons from 4.75 million tons.
Speculative investors were net buyers for a second week, reducing net short positions to the least since the week of August 27, according to the latest data as at October 1 from CFTC.
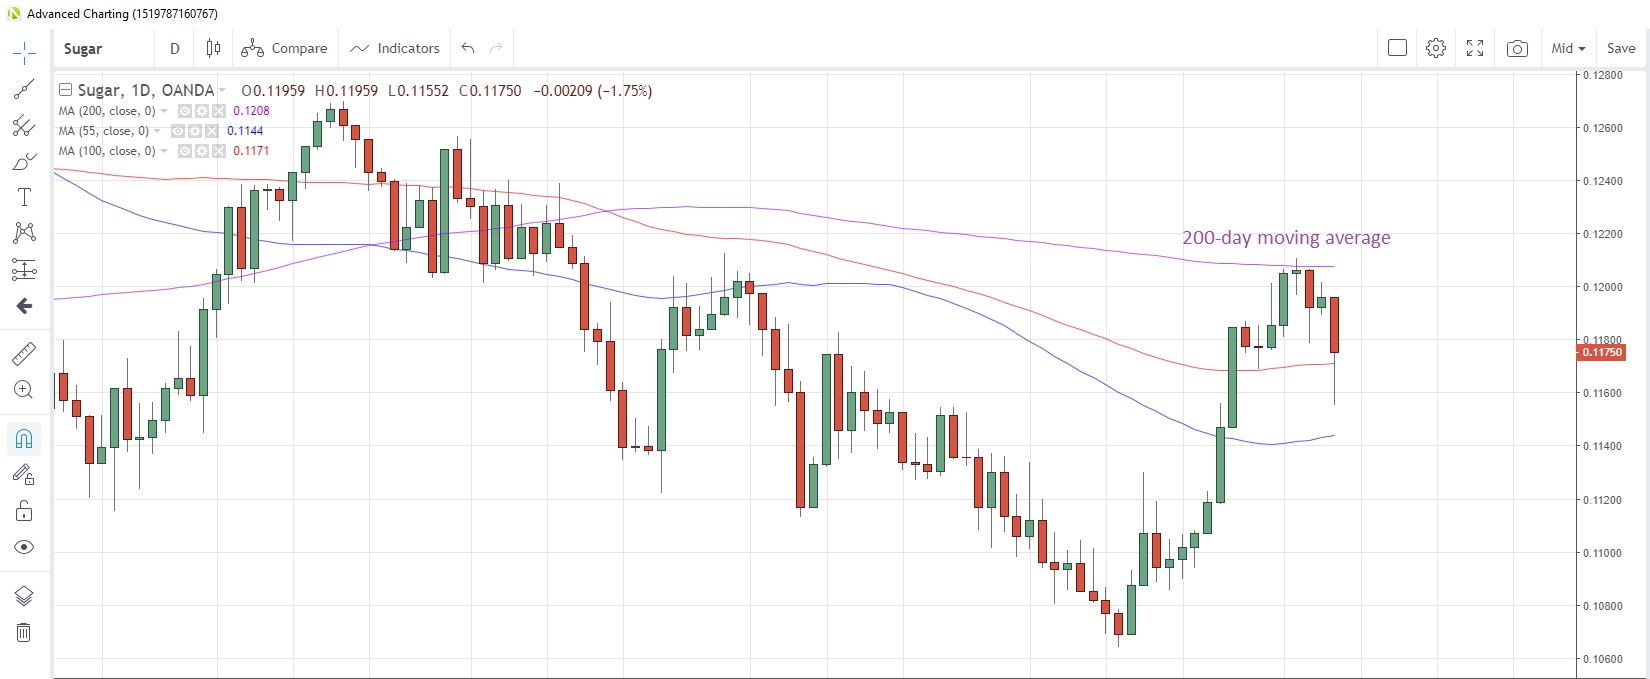
Sugar attempted to take out the 200-day moving average at 0.1208 last week, but it held on a closing basis, and has done since July 3. Sugar closed at 0.1175 last night.
Sugar Daily Chart

WHEAT could be heading for its fourth higher daily close today, but those gains have only been marginal. The commodity remains above both the 200-day moving average at 4.8046 and the 55-day moving average at 4.7815. Speculative long positions have been scaled back to the lowest in four weeks, according the latest data from CFTC.
Russia’s Institute for Agricultural Market Studies (known as IKAR) estimated that Russia’s wheat crop for the 2019/20 season would be 75.4 million tons, 0.5% higher than the previous season.
SOYBEANS are hovering near 3-1/2 month highs after the USDA commented that is expects tighter supplies form the US in the future. Speculative accounts were well positioned for the latest rally, having boosted net long positions to the highest since June 2018 in the latest report from CFTC.
Trump’s Administration has announced a proposal to boost the biofuels market next year, which would bring the amount of CORN-based ethanol in the nation’s fuel mix to 16 billion gallons. Corn prices rose through the 55-day moving average at the start of this month, and have stayed there.
Speculative investors turned net buyers of corn for the first time in 11 weeks in the week to October 1, CFTC data show. That buying pulled net short positions from being the most bearish since May.
