Weeks of speculation and an eventual formal proposal by Russia and OPEC members Qatar, Saudi Arabia and Venezuela to freeze production at January 2016 levels helped lift crude oil prices up by over 20% from their January lows. Implementation, however, requires a freeze by other large OPEC producers. Iran may be most reluctant to capitulate since it has only just begun to export after sanctions were lifted in January. Even if implemented, Russia and most other OPEC members outside of Saudi Arabia were already producing at or above potential. For those reasons the freeze is more smoke and mirrors rather than a prelude to an official cut to OPEC’s quota at its next scheduled meeting in June. In absence of an outright cut, supply of crude oil is expected to exceed demand by nearly 1.4 mb/d in Q2 2016. Hence markets still expect prices to remain depressed in the short term.
No OPEC cut means ending the global glut of crude oil still requires a significant reduction in US supply. While lower prices have taken their toll on US drilling, output has proven relatively resilient due to efficiency gains. The US oil rig count fell to 439 in February from a peak of 1609 in October 2014. Meanwhile, output has stabilized around 9.2mb/d in recent weeks from a peak of 9.6 mb/d in June last year. Increased efficiency is not the only key risk. Between 400-600 kb/d from drilled but not completed wells could come online in a matter of months if prices were to move higher. This is precisely how much US output needs to fall in order to balance the market. While fears of a slump in Chinese demand, a key theme for crude oil over the last six months, may be overdone, uncertainty around US shale is likely to persevere over H1.
High inventories of middle distillates in Northern Europe and US refinery shut downs have caused product tankers from Asia, the Middle East, and Russia to shift course towards the US. Russian refinery cuts should also help ease some of the downward pressure on Northern European diesel refinery margins by limiting excess supply. The start of the refinery maintenance period may also lend some support to refiner profitability. Any relief, however, is likely to prove only temporary as the general glut in global middle distillates persists over the medium term.
Technical & Trading Takeaway
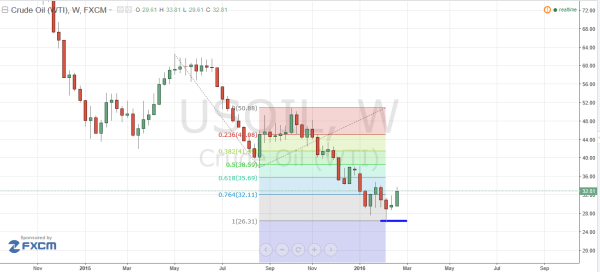
Crude is likely to form a hammer and closing price of this month should be monitored carefully. It has tested the equidistant swing on the weekly scale highlighted in previous reviews at 26.31 and bounced from this symmetry level almost to the tick, while this level remains key support, there is an opportunity for a broader corrective phase of price action.

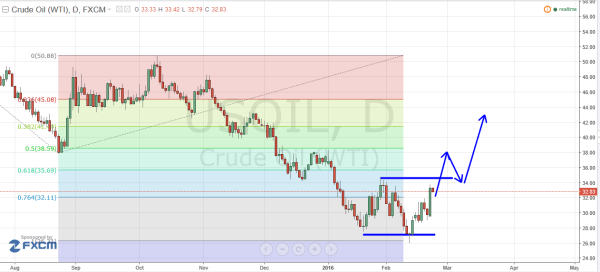
Dropping down to daily chart, crude is developing within a possible double bottom. Confirmation level for the pattern is a close above 34.50. Daily momentum indicators have been diverging positively which indicates possibility of continuation in recovery. A break above 35/36 will increase positive signals and take crude towards 39 with possibility to reach 42/43, projected price potential of the pattern.
From a trading perspective I will be looking for crude to retest the former lows of the AB leg of the larger weekly ab=cd pattern highlighted in the weekly chart above. I expect price to pull back on the initial test of this level, if we are going to trade a larger corrective pattern I will be watching intraday reversal patterns at the previous highs 34.50 to set long positions targeting a test of the 42/43 level. As the price action develops I will update this post with more specific entry,stops and exit parameters.

