
Comcast (NASDAQ:CMCSA) reported third-quarter 2019 adjusted earnings of 79 cents per share that beat the Zacks Consensus Estimate by a penny. The figure increased 16.2% year over year.
Consolidated revenues increased 21.2% year over year to $26.83 billion but lagged the Zacks Consensus Estimate of $26.86 billion.
However, revenues on a pro-forma basis (considering the Sky transaction on Jan 1, 2017) were flat year over year.
Cable Communication Revenue Details
Revenues climbed 4% from the year-ago quarter to $14.58 billion. Total Customer Relationships increased 309K to 31.2 million.
Comcast Corporation Price, Consensus and EPS Surprise
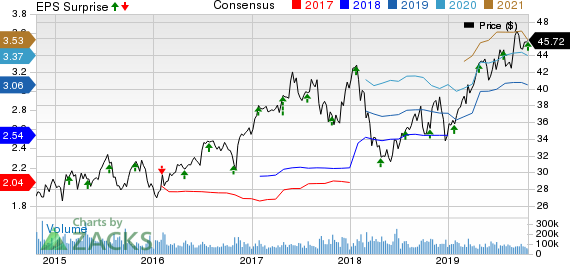
Comcast Corporation price-consensus-eps-surprise-chart | Comcast Corporation Quote
High-speed Internet revenues grew 9.3% year over year to $4.72 billion, primarily driven by increased residential high-speed Internet customers and rate adjustments. Total high-speed Internet customer net additions were 379K.
Business Services revenues were up 9.3% to $1.97 billion, driven by customer base expansion.
Wireless revenues jumped 38.1% to $326 million, supported by an increase in the number of customer lines. Comcast added 204K wireless lines in the reported quarter.
Other revenues rose 13.4% from the year-ago quarter to $459 million, primarily owing to higher sales from security and automation services. Total security and automation customer net additions were 8K in the reported quarter.
Advertising revenues declined 11.9% to $603 million, primarily due to lower political advertising revenues. Excluding political revenues, advertising revenues increased 1.2%.
Voice revenues were $963 million, down 1.9% year over year, due to a declining number of residential voice customers.
Video revenues dropped 0.9% to $5.54 billion, reflecting a decline in the residential video customer count.
Total video customer net losses were 224K, while total voice customer net losses were 65K.
At the end of the third quarter, 65.6% of Comcast’s residential customers received at least two Xfinity products.
NBCUniversal Revenues Down Y/Y
Revenues declined 3.5% year over year to almost $8.30 billion.
Cable Networks’ revenues decreased 2.8% from the year-ago quarter to $2.77 billion, primarily due to lower content licensing & other revenues (down 27.2%), partially negated by higher distribution revenues (up 1.6%). Advertising revenues were flat year over year.
Broadcast Television revenues declined 9.1% from the year-ago quarter to $2.23 billion, thanks to lower advertising (down 12.1%) and content licensing revenues (down 17%), partially offset by increased distribution & other revenues (up 5.8%).
Filmed Entertainment revenues decreased 6.2% from the year-ago quarter to $1.71 billion. Theatrical revenues declined 8.8% due to a lower number of major releases than the year-ago quarter. Home entertainment revenues were down 28.5% year over year.
Theme Parks revenues were $1.63 billion, up 6.8% year over year on higher attendance.
Sky Revenue Details
Pro-forma revenues decreased 4.2% year over year to $4.55 billion. At constant currency (cc), revenues increased 0.9%.
Direct-to-consumer revenues declined 3.2% (up 1.9% at cc) from the year-ago quarter to $3.79 billion.
Content revenues rose 9.4% (up 15.4% at cc) to $376 million, benefiting from higher monetization of its slate of original programming and the wholesaling of sports programming.
Advertising revenues deteriorated 18.2% (down 13.8% at cc) from the year-ago quarter to $446 million, primarily due to the impact of a change in legislation related to gambling advertisements in the U.K. and Italy along with overall market weakness.
Pro-forma Total Customer Relationships decreased 99K to 23.9 million in the reported quarter.
Operating Details
Consolidated programming & production costs increased 23.9% from the year-ago quarter to $8.32 billion. As a percentage of revenues, programming & production costs expanded 70 basis points (bps) on a year-over-year basis to 31%.
Consolidated adjusted EBITDA grew 17% from the year-ago quarter to $8.55 billion. Pro-forma (including Sky operations) adjusted EBITDA increased 7.4%.
Segment-wise, Cable Communications’ adjusted EBITDA rose 6.7% from the year-ago quarter to $5.80 billion. Cable Communications operating expenses increased 2.3% year over year on higher non-programming costs.
Cable Communications results include a loss of $94 million from the wireless business compared with a loss of $178 million in the year-ago quarter.
NBCUniversal’s adjusted EBITDA increased 1.6% from the year-ago quarter to $2.09 billion, reflecting growth in Broadcast Television and Theme Parks adjusted EBITDA.
Sky’s adjusted EBITDA on a pro-forma basis rose 38.3% (up 46% at cc) to $899 million. Notably, Sky’s operating costs and expenses fell 10.9% (down 6.2% at cc) to $4.06 billion.
Consolidated operating income grew 10.4% year over year to $5.34 billion. However, operating margin contracted 190 bps from the year-ago quarter to 19.9%.
Cash Flow & Liquidity
As of Sep 30, 2019, cash and cash equivalents were $3.51 billion, down from $3.92 billion as of Jun 30, 2019.
Moreover, as of Sep 30, 2019, consolidated total debt was $100.89 billion, down from $109.09 billion as of Jun 30, 2019.
In third-quarter 2019, Comcast generated $5.19 billion of cash from operations compared with $7 billion in the previous quarter.
Capital expenditures were up 5.3% to $2.5 billion. NBCUniversal’s capital expenditures rose 24.7% to $505 million. Sky reported capital expenditures of $104 million.
Free cash flow was $2.1 billion in the reported quarter, down from $4.20 billion generated in the previous quarter.
During the quarter, Comcast paid out dividends worth $955 million.
Zacks Rank & Stocks to Consider
Currently, Comcast carries a Zacks Rank #3 (Hold).
Activision Blizzard (NASDAQ:ATVI) , Discovery (NASDAQ:DISCA) and Lionsgate Entertainment LGF.A are stocks worth considering in the broader consumer & discretionary sector. All three stocks carry a Zacks Rank #2 (Buy). You can see the complete list of today’s Zacks #1 Rank (Strong Buy) stocks here.
Activision Blizzard, Discovery and Lionsgate are scheduled to report quarterly results on Nov 7.
Today's Best Stocks from Zacks
Would you like to see the updated picks from our best market-beating strategies? From 2017 through 2018, while the S&P 500 gained +15.8%, five of our screens returned +38.0%, +61.3%, +61.6%, +68.1%, and +98.3%.
This outperformance has not just been a recent phenomenon. From 2000 – 2018, while the S&P averaged +4.8% per year, our top strategies averaged up to +56.2% per year.
See their latest picks free >>
Comcast Corporation (CMCSA): Free Stock Analysis Report
Lions Gate Entertainment Corp. (LGF.A): Free Stock Analysis Report
Discovery, Inc. (DISCA): Free Stock Analysis Report
Activision Blizzard, Inc (ATVI): Free Stock Analysis Report
Original post
Zacks Investment Research