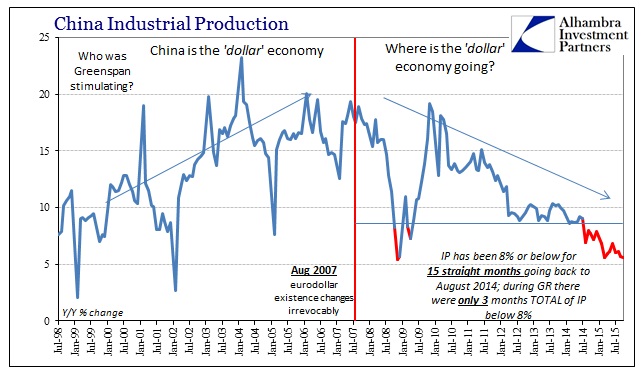
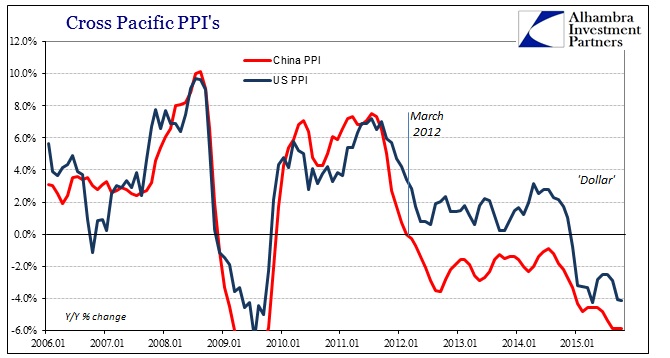
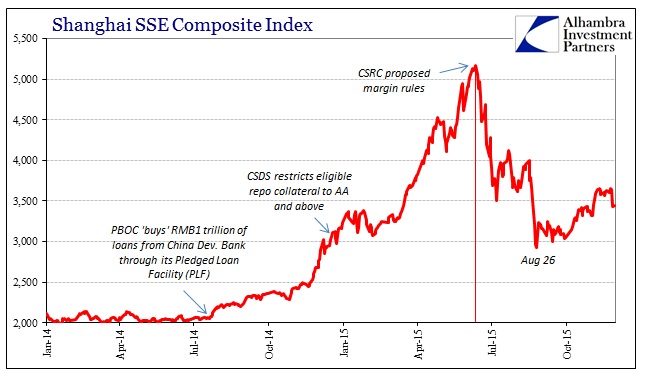
Chinese stocks “unexpectedly” plunged last week in a fit of stormed selling that reminded of August rather than the placidity that has been claimed of China since. By mainstream accounts, China has fixed its bout of “selling UST” and “outflows” while also providing two double doses of “stimulus.” The PBOC had even taken to a higher fix in the middle rate, the policy setting that defines the RMB trading band. In light of all that, the 5.5% crash Friday seems so out of place.
That is why, it appears, commentary has focused upon government investigations into certain large brokerage firms and their “practices.” Like the June peak in Chinese stocks, then blamed on margin rules proposals from CSRC, there seems a bit more to it than that. For all the talk about normalizing financial conditions in China since August, there is very little that actually supports such a conclusion. Again, even the conventional assessments regarding the most visible difficulty are flawed by their cursory nature, and that “outflows,” which are nothing more than shorthand for “dollar” difficulties, remain the baseline of Chinese financial existence.
In that view, the fact that Chinese stocks would again run into heavy and intense selling isn’t surprising, especially given the clear and emphatic amplification of liquidity difficulties just in the past few weeks. November was particularly troublesome, tracing back, counterintuitively, to the October 23 double shot of “stimulus” (double meaning both a rate cut in the benchmark rate plus a reduction in the required reserve). Instead, it’s as if the typical monetarisms have been met as the anti-liquidity:
China’s economy is still showing a muted response to waves of monetary and fiscal easing as of the half-way mark for the last quarter of the year, some of the earliest indicators suggest. A privately compiled purchasing managers’ index and a gauge based on search engine interest in small and medium-sized businesses deteriorated this month, while a sentiment indicator dropped sharply from October.
China’s worst economic slowdown in a quarter century is also weighing on companies’ ability to repay bonds. China Shanshui Cement Group Ltd (HK:0691) this month became at least the sixth company in 2015 to default on yuan-denominated domestic notes. State-owned steel trader Sinosteel Co. postponed a bond payment for a second time last week.
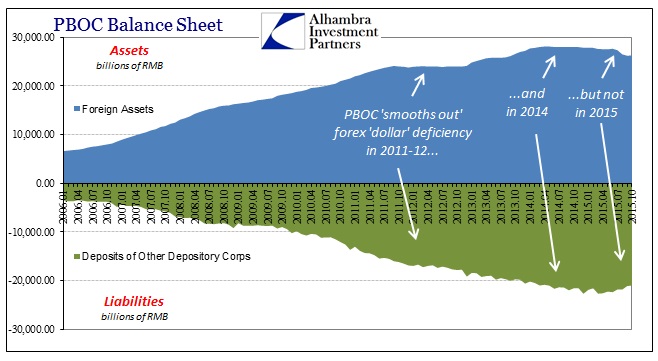
Renewed defaults on top of the stock price mess and a Chinese economy that is seemingly and uncontrollably sucked into the global “deflationary vortex” (to turn Krugman’s phraseon its ear) doesn’t at all seem like the expression of relief that was common and emphasized during September and especially October. While that all sounded nice, a quick check of RMB reality in the form of the PBOC balance sheet easily disproved those particulars. China has a depository liability problem, which, in the traditional banking context, means a real money problem.
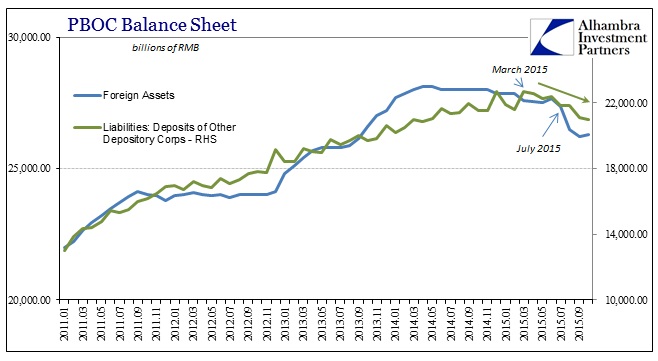
Since March, the PBOC has been “bleeding” its liability side, which amounts to actual and useful reserves (quite contrary to the inert byproducts on similar account at the Federal Reserve) inside the RMB system (which gives us insight into the 250 bps in reduced reserve requirements since April 19). The impetus for the reduction in liabilities is both the forex problem on the asset side (“dollars”) and the wholesale dynamics that attended them. That much is clear by the remarkable and obvious change in the CNY/USD exchange rate that began right at March:
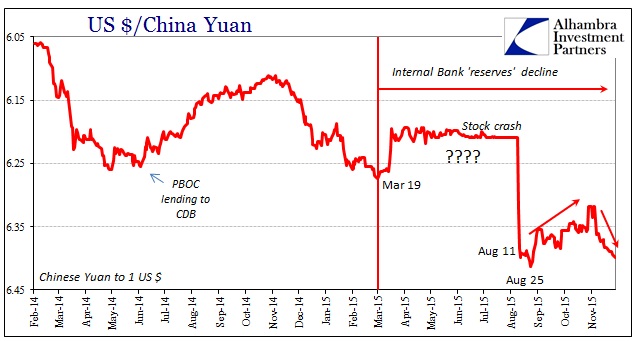
The left side on the chart immediately above is “normal” (for China) trading behavior that you would expect given undetached mechanics; the right side, however, shows continuous and anomalous behavior that just so happens to coincide with the reduction in Chinese bank “reserves.” That, again, more than suggests “dollar” difficulties turning into something far more difficult around March, with particular emphasis in early July – meaning the Chinese stock market peaked just as things were getting “interesting.” Notice the almost complete lack of any volatility in the CNY exchange starting just as Chinese stocks started their crashing.
By all these counts, nothing has changed even after August and September. The same interruptions are just as disturbing now as then, only it seems as if the PBOC has run out of options to hide and suppress it all. The central bank attempted first to stamp out all volatility in the exchange rate itself but only to put its own wholesale “dollar” connection at great risk; which was indeed the case as evidenced by the activities in August. Since then, the PBOC has been confined to secondary influence, in SHIBOR and various but looser CNY fixing, but only to run aground with each at the same dead end.
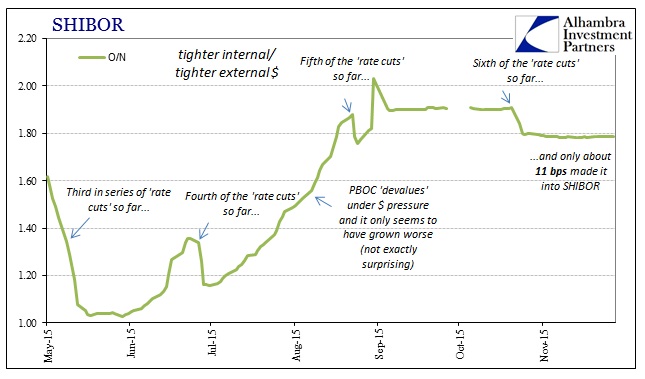
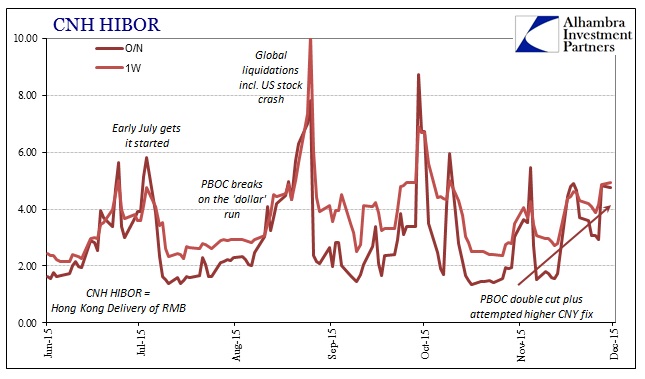
The problem remains “dollar,” which is why the CNY exchange rate continues to be the central axis and funding pivot; the CNY fix gives the Chinese banking system a limit upon the cost at which it can bid to rollover “dollar” funding (the “short”). If the PBOC fixes too “strong,” the Chinese system is under artificial funding constraints that shows up as CNH “tightening” as well as CNY impulsiveness. In the latest case of illiquidity, as you can see immediately above, not only are CNH HIBOR rates sharply higher and reminiscent of September, the PBOC has pushed/lowered its middle rate (fix) to nearly 6.40 in response – to allow Chinese banks to bid for “dollars” at greater and greater cost (i.e., a shortage).
In that circumstance, again, it is unsurprising to see Chinese stocks so vulnerable in addition to the country’s credit markets under even greater strain (more defaults and whispers of still more). There was no systemic rebound in September and October, only the limitations of the central bank’s ability to hide as much as it could; which was enough, apparently, for conventional commentary. Instead, via the PBOC’s own dynamics, the “dollar” change last June remains the dominant force as is whatever shifted in March with regard to the relatedinternal conditions.
It makes for a very interesting contrast, whereby a (more) traditional monetary system is being directly challenged by another so unfamiliar and unlike. It amounts to the traditional elements of money supply, except being forced to reckon with the “dollar” as its primary agent. When I write that the eurodollar system built China, that is only partly metaphorical. In this manner, it is (was) literal and now it flows in reverse, with all these ongoing consequences related to that paradigm alteration.
