Bitcoin price today: muted at $86.5k ahead of US CPI data
Some Charts that Explain Doubts about Quantitative Easing and What they Mean for the FOMC
In a recent speech, Atlanta Fed President Dennis P. Lockhart took note of divisions within the Federal Open Market Committee (FOMC) as to whether further quantitative easing (QE) would be effective. When I cited Lockhart’s remarks in a post, a commenter expressed surprise. Yes, said the comment, it is possible to see how some people might doubt that QE would have a beneficial effect on the real economy, but how could anyone, especially inside the Fed, think that large-scale expansionary policy would not speed the growth of nominal GDP?
The continued doubts can be expained, at least in part, with three charts that show the limited effects of past QE. Before showing them, though, it will be worth reviewing how expansionary monetary policy is supposed to work.
The first important point is that the Fed has no direct control over market interest rates. Except for a few administrative rates (the discount rate and the deposit rate on reserves), the Fed can influence interest rates only indirectly through open market operations, that is, purchases and sales of items from its portfolio of assets. It carries out day-to-day open market operations mostly with repurchase agreements on short-term instruments like T-bills. QE involves larger, longer-term purchases of a greater variety of long- and short-term assets.
When the Fed buys assets from the public, the funds it uses to pay for them appear on the right-hand side of its balance sheet as an increase in the monetary base—the sum of bank reserve deposits and currency. An increase in the reserves component of the monetary base is supposed to stimulate lending by banks, which in turn, causes the money stock (M2) to expand. Just how much it expands depends on the money multiplier—the ratio of M2 to the base.
Finally, an increase in the money stock is supposed to stimulate spending, so that nominal GDP increases. How much it increases depends on velocity, that is, the ratio of nominal GDP to M2.
Your Econ 101 textbook calls all of this the transmission mechanism for monetary policy. The question is, then, how well has the transmission mechanism actually worked for the recent episodes of quantitative easing, popularly known as QE1 and QE2? If we look at the following chart, we see that it has not worked very well.

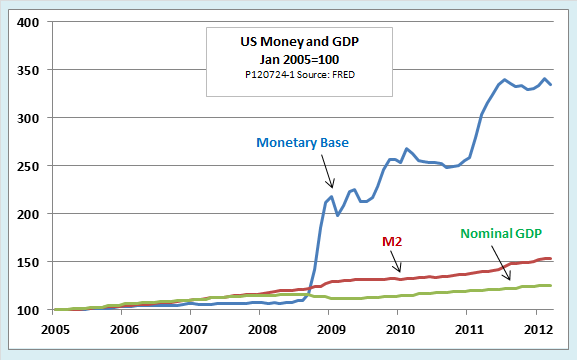
The chart shows that over the past four years, the Fed has done a fine job of expanding the monetary base. QE1 and QE2 stand out as the steep segments of the top line. The transmission mechanism is another story, however.
Until 2008, the base, M2, and GDP (in the chart, all of them are normalized so that 2005 = 100) move closely together. The close relationship of these variables would continue back as far as one cared to extend the chart; this one starts in 2005 only in order to show the years since 2008 in greater detail. Since 2008, though, the monetary base has gone its own way. The quantity of money in circulation has increased only modestly. The effect on nominal GDP was even smaller. Nominal GDP actually fell in the immediate aftermath of QE1. Since then, it has struggled even to reach its historical trend, despite the modest expansion of M2 achieved by QE2.
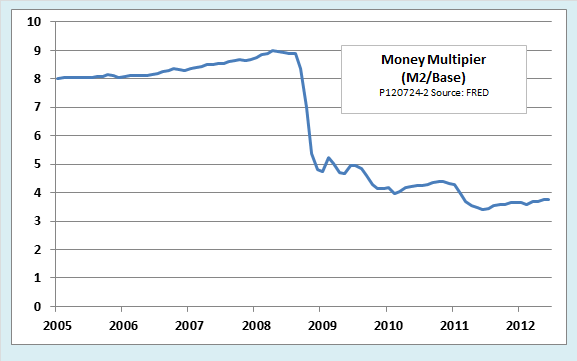
The widening gap between the base and M2 indicates that the money multiplier, one key element of the transmission mechanism, has fallen. The next chart, which shows the money multiplier directly, indicates just how much. Most of the decrease in the money multiplier is attributable to growth of bank reserves.

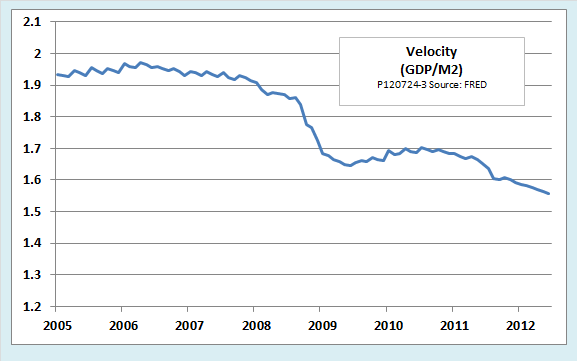
The gap between M2 and nominal GDP shows a decrease in velocity, another key element of the transmission mechanism. Velocity, roughly speaking, measures the number of times per year people spend each dollar of the money stock to purchase the final goods and services that go into GDP. When interest rates are high, firms and households sharpen their cash management practices so that they can do their business with the smallest money balances possible. When interest rates are low, as they have been since 2008, there is less incentive to economize on cash, so firms and households allow idle liquid balances to accumulate.

The charts clearly show why there are doubts about the effectiveness of quantitative easing. However, they do not conclusively show that further QE would be a bad idea.
Those who favor further expansionary monetary policy argue that past efforts have simply been too timid. There is no practical limit to how large the Fed’s balance sheet can grow. Double it again, quadruple it, keep going long enough and the nominal GDP line surely will begin to budge. In the unikely event that it suddenly grows too rapidly, say QE advocates, the Fed has plenty of tools available to shrink its balance sheet rapidly if it needs to.
The bottom line: Yes, there are reasons to think the transmission mechanism is weak and to be disappointed with the effects of past quantitative easing. Looking ahead to next week’s FOMC meeting, that is a strong argument against announcing any further QE program that is limited either in time or in size. In view of recent experience, as reflected in the above charts, limited QE would not be enough to change expectations and, therefore, might accomplish nothing at all.
Aggressive, open-ended QE could be another story. As Sebastian Mallaby argues in yesterday’s Financial Times, such a program would work best if it were anchored in an explicit target. Chicago Fed president Charles Evans suggests a 3 percent inflation target until unemployment reaches 7 percent. An explicit nominal GDP target would be even better. If the FOMC has no stomach for such a bold program, it might be better to do nothing rather than further tarnish the reputation of QE with a program that is too small to work.
Original post
In a recent speech, Atlanta Fed President Dennis P. Lockhart took note of divisions within the Federal Open Market Committee (FOMC) as to whether further quantitative easing (QE) would be effective. When I cited Lockhart’s remarks in a post, a commenter expressed surprise. Yes, said the comment, it is possible to see how some people might doubt that QE would have a beneficial effect on the real economy, but how could anyone, especially inside the Fed, think that large-scale expansionary policy would not speed the growth of nominal GDP?
The continued doubts can be expained, at least in part, with three charts that show the limited effects of past QE. Before showing them, though, it will be worth reviewing how expansionary monetary policy is supposed to work.
The first important point is that the Fed has no direct control over market interest rates. Except for a few administrative rates (the discount rate and the deposit rate on reserves), the Fed can influence interest rates only indirectly through open market operations, that is, purchases and sales of items from its portfolio of assets. It carries out day-to-day open market operations mostly with repurchase agreements on short-term instruments like T-bills. QE involves larger, longer-term purchases of a greater variety of long- and short-term assets.
When the Fed buys assets from the public, the funds it uses to pay for them appear on the right-hand side of its balance sheet as an increase in the monetary base—the sum of bank reserve deposits and currency. An increase in the reserves component of the monetary base is supposed to stimulate lending by banks, which in turn, causes the money stock (M2) to expand. Just how much it expands depends on the money multiplier—the ratio of M2 to the base.
Finally, an increase in the money stock is supposed to stimulate spending, so that nominal GDP increases. How much it increases depends on velocity, that is, the ratio of nominal GDP to M2.
Your Econ 101 textbook calls all of this the transmission mechanism for monetary policy. The question is, then, how well has the transmission mechanism actually worked for the recent episodes of quantitative easing, popularly known as QE1 and QE2? If we look at the following chart, we see that it has not worked very well.

The chart shows that over the past four years, the Fed has done a fine job of expanding the monetary base. QE1 and QE2 stand out as the steep segments of the top line. The transmission mechanism is another story, however.
Until 2008, the base, M2, and GDP (in the chart, all of them are normalized so that 2005 = 100) move closely together. The close relationship of these variables would continue back as far as one cared to extend the chart; this one starts in 2005 only in order to show the years since 2008 in greater detail. Since 2008, though, the monetary base has gone its own way. The quantity of money in circulation has increased only modestly. The effect on nominal GDP was even smaller. Nominal GDP actually fell in the immediate aftermath of QE1. Since then, it has struggled even to reach its historical trend, despite the modest expansion of M2 achieved by QE2.
The widening gap between the base and M2 indicates that the money multiplier, one key element of the transmission mechanism, has fallen. The next chart, which shows the money multiplier directly, indicates just how much. Most of the decrease in the money multiplier is attributable to growth of bank reserves.

The gap between M2 and nominal GDP shows a decrease in velocity, another key element of the transmission mechanism. Velocity, roughly speaking, measures the number of times per year people spend each dollar of the money stock to purchase the final goods and services that go into GDP. When interest rates are high, firms and households sharpen their cash management practices so that they can do their business with the smallest money balances possible. When interest rates are low, as they have been since 2008, there is less incentive to economize on cash, so firms and households allow idle liquid balances to accumulate.

The charts clearly show why there are doubts about the effectiveness of quantitative easing. However, they do not conclusively show that further QE would be a bad idea.
Those who favor further expansionary monetary policy argue that past efforts have simply been too timid. There is no practical limit to how large the Fed’s balance sheet can grow. Double it again, quadruple it, keep going long enough and the nominal GDP line surely will begin to budge. In the unikely event that it suddenly grows too rapidly, say QE advocates, the Fed has plenty of tools available to shrink its balance sheet rapidly if it needs to.
The bottom line: Yes, there are reasons to think the transmission mechanism is weak and to be disappointed with the effects of past quantitative easing. Looking ahead to next week’s FOMC meeting, that is a strong argument against announcing any further QE program that is limited either in time or in size. In view of recent experience, as reflected in the above charts, limited QE would not be enough to change expectations and, therefore, might accomplish nothing at all.
Aggressive, open-ended QE could be another story. As Sebastian Mallaby argues in yesterday’s Financial Times, such a program would work best if it were anchored in an explicit target. Chicago Fed president Charles Evans suggests a 3 percent inflation target until unemployment reaches 7 percent. An explicit nominal GDP target would be even better. If the FOMC has no stomach for such a bold program, it might be better to do nothing rather than further tarnish the reputation of QE with a program that is too small to work.
Original post
