Get 40% Off
🚨 Volatile Markets? Find Hidden Gems for Serious Outperformance
Find Stocks Now

7 Charts I'm Watching Right Now

Published 05/18/2016, 12:23 AM
Updated 07/09/2023, 06:31 AM

Here are a few of the charts that currently have my attention:

1) The Canadian Dollar

The CAD usually trends with commodity prices, so the owners of commodity-related investments should view the CAD’s recent performance as a warning shot.
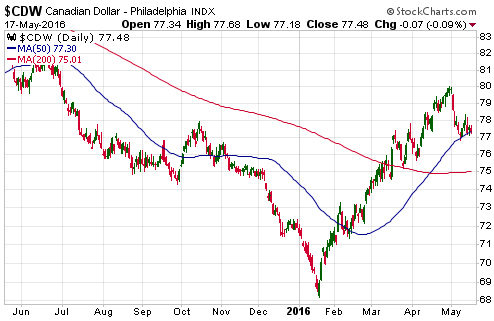
CAD Daily

2) The Dow Trucking Index

The huge rebound in this index from its January low is a little strange given the evidence that the trucking industry is in a recession, and that it's a long way from complete.
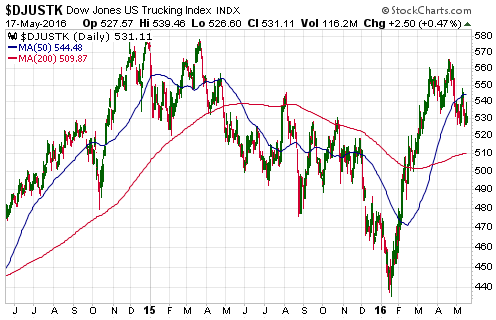
DJUSTK Daily 2014-2016

3) The Gold/GYX Ratio

This gold relative to industrial metals ratio is a boom-bust indicator and an indicator of financial crises. In January of this year it got almost as high as its 2009 peak (its all-time high) and remains close to its peak, so its current message is that an economic bust is in progress and/or that a financial crisis is unfolding.

I think that gold will weaken relative to industrial metals such as copper for at least 12 months after the stock market reaches a major bottom, but in the meantime a new all-time high for the gold/GYX ratio is a realistic possibility.
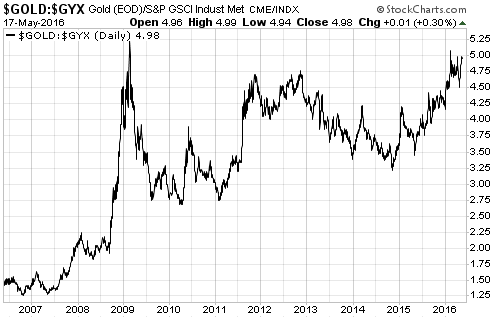
Gold:GYX 2006-2016

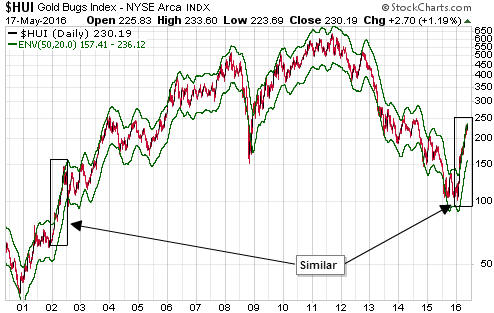
4) The HUI with a 50/20 MA Envelope

This chart reflects a 20% envelope around the 50-day moving average. Although I think that the current situation has a lot more in common with the first half of 2001 than the first half of 2002, the way the Gold BUGS Index (HUI) has clung to the top of its MA envelope over the past few months looks very similar to what it did during the first half of 2002.
3rd party Ad. Not an offer or recommendation by Investing.com. See disclosure here or remove ads .

HUI Daily with 50.20. Env 2000-2016

5) The HUI/S&P 500 Ratio

Over the course of this year to date, the performance of the HUI/SPX ratio—the gold-mining sector relative to the broad US stock market—has been similar to its performance from November 2000 through to May 2001.
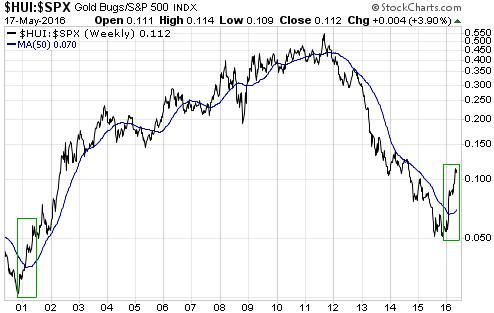
HUI:SPX Weekly 2000-2016

6) The S&P 500 Index

The SPX is standing at the precipice. The probability of a crash within the next two months is almost zero, but a tradable decline looks likely.
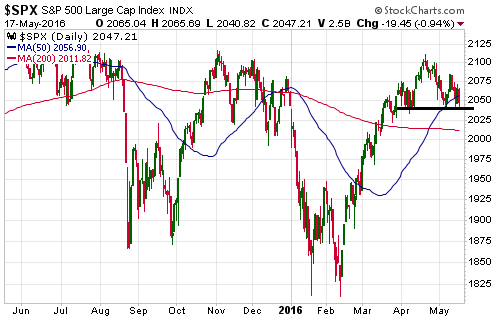
SPX Daily

7) The SPX/USB Ratio

(the broad US stock market relative to the Treasury Bond).

Notice the difference between performance of the broad US stock market relative to the 30-Year Treasury bond following the 2014 peak and performance following the major peaks of 1999-2000 and 2007.
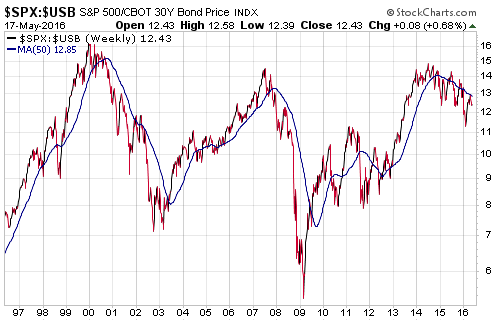
SPX:USB Weekly 1996-2016

Latest comments

Risk Disclosure: Trading in financial instruments and/or cryptocurrencies involves high risks including the risk of losing some, or all, of your investment amount, and may not be suitable for all investors. Prices of cryptocurrencies are extremely volatile and may be affected by external factors such as financial, regulatory or political events. Trading on margin increases the financial risks.
Before deciding to trade in financial instrument or cryptocurrencies you should be fully informed of the risks and costs associated with trading the financial markets, carefully consider your investment objectives, level of experience, and risk appetite, and seek professional advice where needed.
Fusion Media would like to remind you that the data contained in this website is not necessarily real-time nor accurate. The data and prices on the website are not necessarily provided by any market or exchange, but may be provided by market makers, and so prices may not be accurate and may differ from the actual price at any given market, meaning prices are indicative and not appropriate for trading purposes. Fusion Media and any provider of the data contained in this website will not accept liability for any loss or damage as a result of your trading, or your reliance on the information contained within this website.
It is prohibited to use, store, reproduce, display, modify, transmit or distribute the data contained in this website without the explicit prior written permission of Fusion Media and/or the data provider. All intellectual property rights are reserved by the providers and/or the exchange providing the data contained in this website.
Fusion Media may be compensated by the advertisers that appear on the website, based on your interaction with the advertisements or advertisers.
© 2007-2024 - Fusion Media Limited. All Rights Reserved.