BOJ raises interest rates to 30-year high; sees potential for more hikes
by Pinchas Cohen
While market players have been ridiculing U.S. President Donald Trump for the capricious nature of the promises he made during the campaign, it's perhaps worth pointing out that these very same players may actually have set a new standard for fickleness. After all, weren't they the ones who—after election results were announced—handily propelled the market's recent reflation trade to new record highs by betting on...none other than Donald Trump.
Beginning on November 9, 2016, the frenzy with which investors bought any assets they could get their hands on, including equities, debt and of course the US dollar, was fast and furious. However, come December, the raucous herd took a step back and stopped to graze. Since then, while equities resumed the reflation trade, dollar and bond investors seem to have lost interest.
While the action in equities is likely the natural outcome of a financial butterfly effect, Trump and Treasury Secretary Steven Mnuchin have actively worked to devalue the dollar. In December, when the greenback's run ended, Trump told the Wall Street Journal that the too strong dollar is “killing us.” In January, Mnuchin’s wrote a response to the Senate after his confirmation hearing, stating that a too strong dollar could have a negative effect on the economy in the short term.
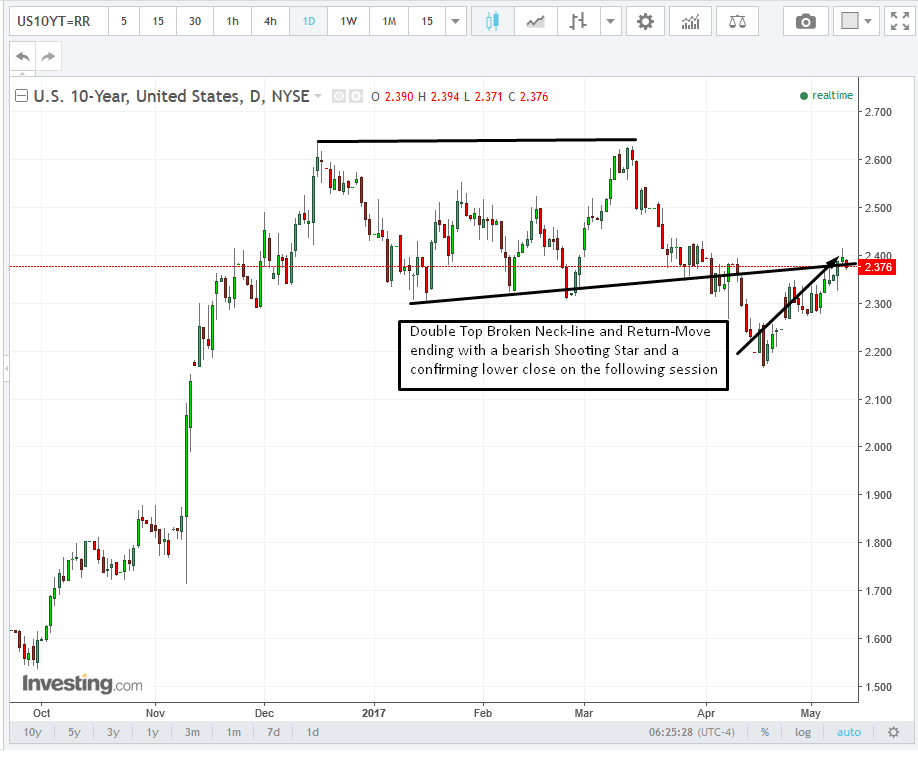
The rhetoric was a clear signal regarding where the administration wants the dollar to go and it has complied. Over the same period, Treasury yields have completed a double top and finished a return move to the neck line.

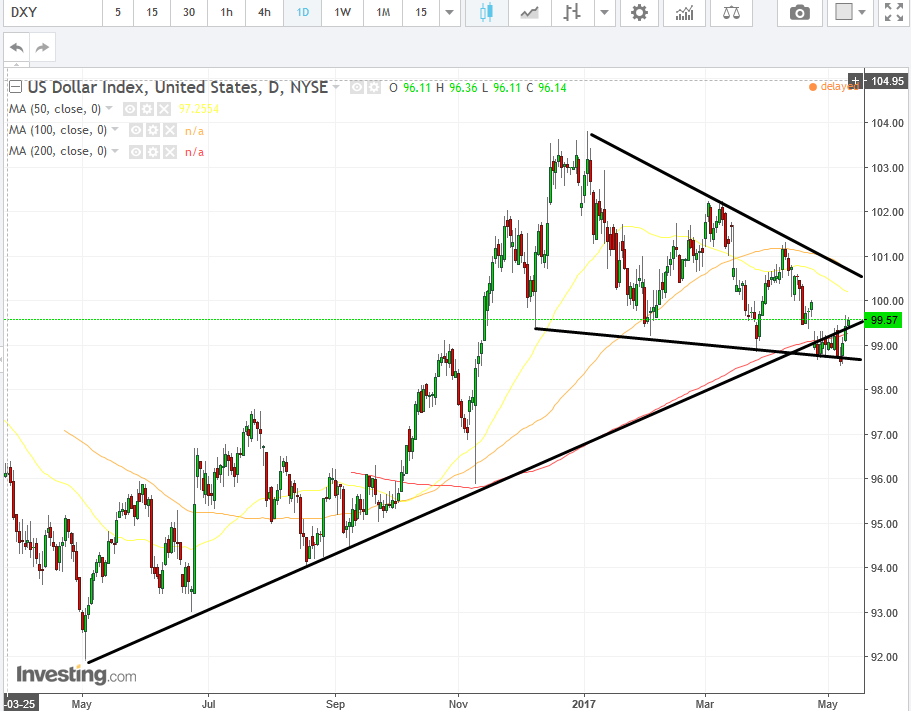
Now, the US Dollar Index is holding on for dear life to the uptrend line which began in May.

Since the peak of the dollar trade in December, the index has been making lower highs and lower lows, all the way back to its year-long rising trend line. On the day it reached the trend line, it opened with a 1 percent falling gap, fell below the uptrend line as well as the 200dma, fluctuated throughout the session and managed to close with a 0.12% gain, but at the same time with a 0.82% loss.
While the dollar managed to close with its chin just over the uptrend line, it was still under the 200dma, where it formed an extremely rare gap for currencies. Yesterday's multiple rounds of Fedspeak helped prop up the dollar and it climbed back above the trend line as well as the 200dma.
This falling gap, right on top of this uptrend line, along with the following 13 congested sessions are both indicative of the significance of this uptrend line. A sharp move followed by congestion are characteristics of a continuation pattern.
If there's a breakout in the same direction prior to the congestion, a repeat move in magnitude is expected. However, should there be a close over 100 in this case, it would signal that the uptrend endures.
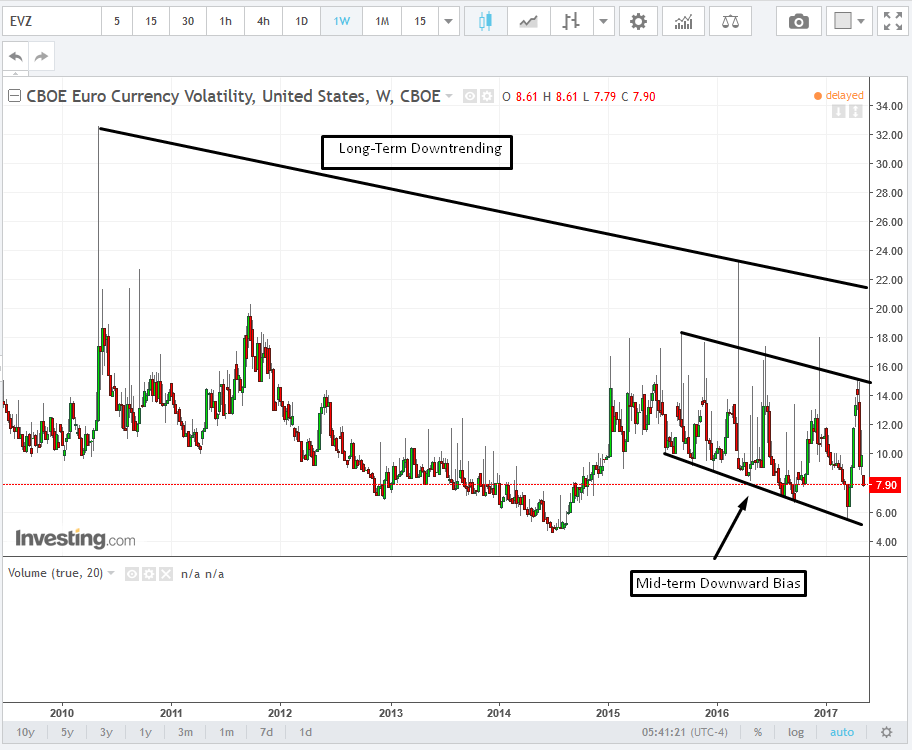
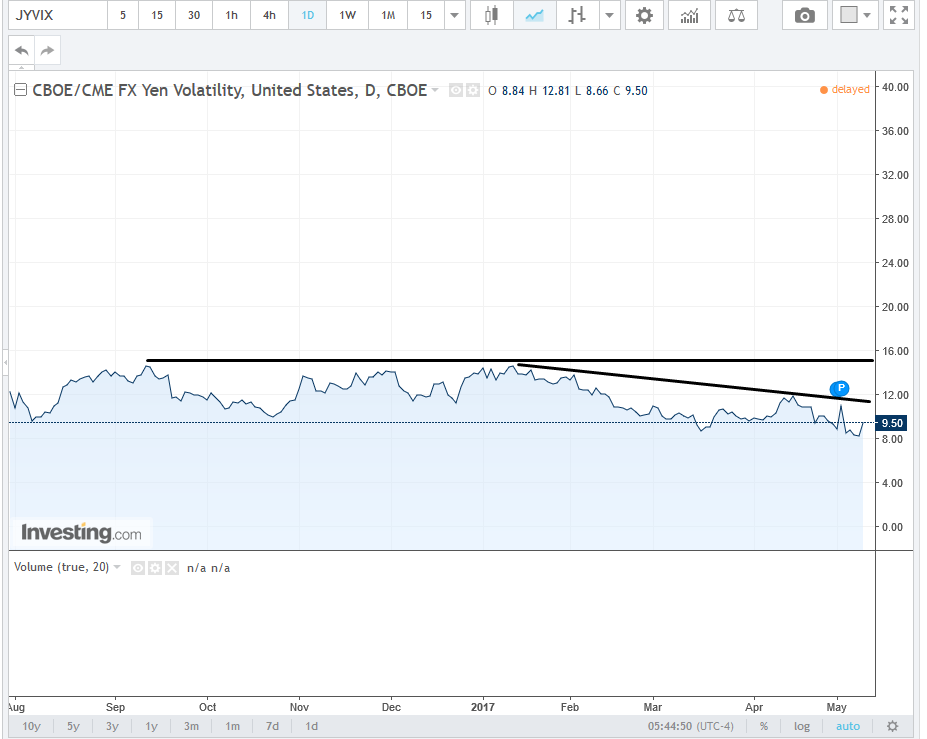
Another way to approach which way the Dollar Index may be headed is by measuring implied future volatility through the prism of the options market. A lower implied volatility for the euro and yen suggests a mirror image for the dollar, since investors feel more confident holding euro and yen when confidence in the dollar decreases.


Since the CBOE Euro Currency Volatility Index and the CBOE/CME FX Yen Volatility Index, pictured above, are clearly in downtrends, where do you think the Dollar Index is headed next?
