Micron surges after one of the biggest beats in U.S. semis history
The last couple of days demonstrate the imprudence of trading the news. Yesterday stocks fell, because President Donald Trump banned Huawei, and today U.S. futures point to a firm open, because Trump’s administration has given the Chinese telecom giant an exemption for 90 days.
As it's impossible to know whether China will satisfy the U.S. president’s negotiation expectations, manipulate its currency, dump Treasurys, or what Trump will tweet, trading the news leaves investors chasing the market.
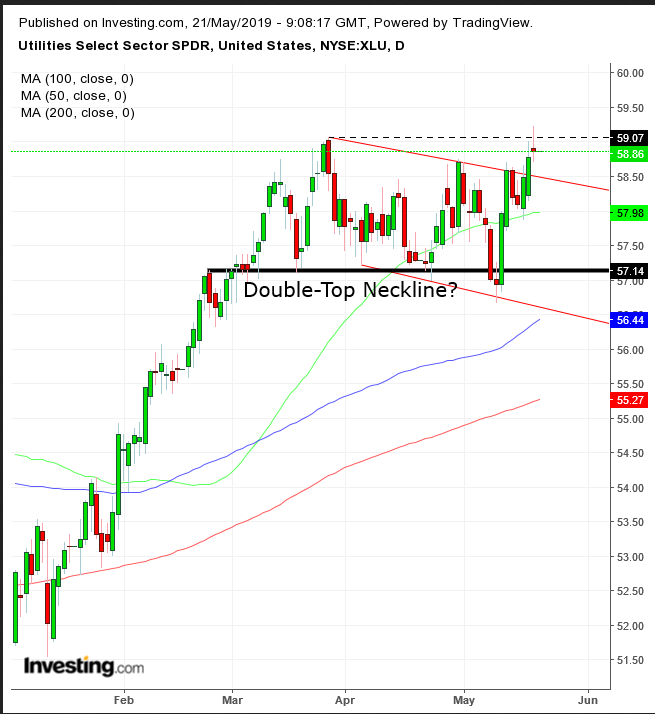
However, some signs have been flashing red that didn’t make it to headlines. While averages are falling, defensive stocks are registering records. Consumer Staples posted a fresh record Thursday, and Utilities hit an all-time high yesterday.

The price extended an upside breakout of a trading range, as demand absorbed all the available supply at those levels and upped bids for more Utilities securities. The mechanical chain reaction of a short squeeze and triggered long positions, compounded by the psychological dynamic paints an outlook for a continued rally for Utilities Select Sector SPDR (NYSE:XLU).
On the other hand, the price failed to hold on to its record highs and closed below its March 26 record close, suggesting uncertainty. The trading pattern formed a high wave candle, expressing a lack of leadership – poignant amid an all-time high, creating the potential for a double-top - reflecting the earlier argument that traders are becoming disillusioned with stocks.
At record levels, they are not cheap, anyway. In summary, the conflicting signals for Utilities seem to project two optional outlooks, going from bad to worse: the sector’s rise as investors shelter capital, or its topping out because traders seek more reliable havens outside equities.
Trading Strategies
Conservative traders will wait for a new all-time high – with a solid candle, showing a unified force – to undo the pessimism the high-wave candle exudes. Then, they would wait for a return move to demonstrate support, with a base forming above the upper boundary of the congestion, with at least one, long green candle engulfing a red or small candle of either color.
Moderate traders follow the same trading pattern described above, along with the pullback for a better entry, not necessarily for confirmation of trend.
Aggressive traders may short today’s expected advance based on future contracts, providing they follow a carefully laid trading plan that fits their account needs.
Trade Sample
- Entry: $59.00
- Stop-Loss: $59.25, above yesterday’s high
- Risk: $0.25
- Target: $58.25, above the range’s falling upper boundary
- Reward: $0.75
- Risk-Reward Ratio: 1:3
