Get 40% Off
👀 👁 🧿 All eyes on Biogen, up +4,56% after posting earnings. Our AI picked it in March 2024.
Which stocks will surge next?
Unlock AI-picked Stocks

Chart Of The Day: S&P 500 Setting Up For Another Selloff

Published 03/05/2020, 09:54 AM
Updated 09/02/2020, 02:05 AM

After yesterday’s second 4% surge for U.S. equity markets within three days, it's clear that bulls are getting hungrier. However, we would urge caution: this exuberance is not likely to last. In fact, we expect the S&P 500 is about to tumble.

Since Friday, which capped the worst sell off in U.S. stocks since the 2008 crash, the benchmark index has zigzagged every day. On Monday the SPX rebounded, surging over 4% after news that Group of Seven finance ministers and central bankers would hold a teleconference Tuesday to discuss how to respond to the fast-spreading coronavirus outbreak.

On Tuesday the index sold off by almost 3% on worries the Fed emergency cut won’t be enough to combat the economic impact of the virus. Finally, yesterday, the average jumped 4% again, after Democratic Presidential hopeful Joe Biden’s Super Tuesday victory allayed investors' concerns of disruptive socialistic changes followed by Congress’ $8 billion cash injection.

Earlier today, U.S. futures bucked the Asian session rally. Bullish investors might have laughed it off as just profit-taking after yesterday’s 4% surge, the second within 3 days. Maybe. But European stocks are lower as well.

So maybe it's not about profit taking. From a technical perspective, the S&P 500’s risk is to the downside.
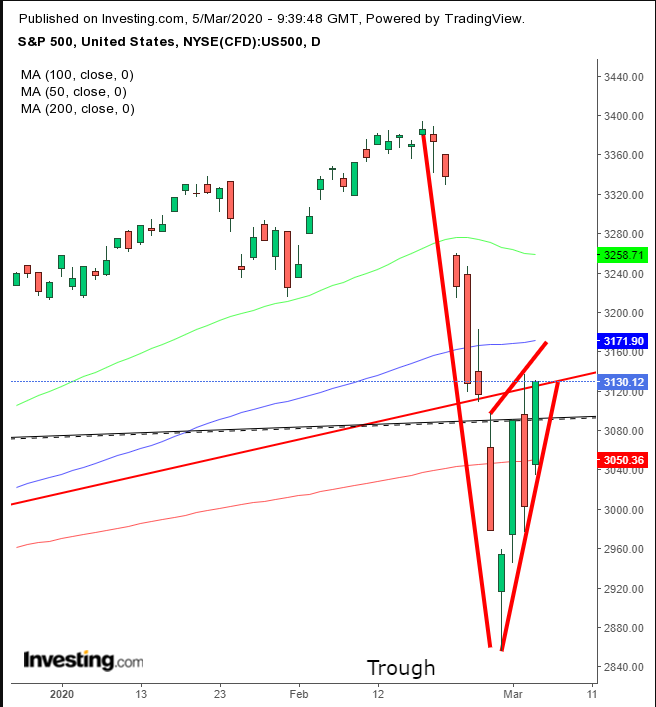
SP Daily Chart

The S&P 500 index has been converging with an upward tilt since the Feb. 28 bottom, following a straight line down since Feb. 19. That constitutes a rising flag, expected to follow with a downside breakout, after bears drown out all demand at current levels.

3rd party Ad. Not an offer or recommendation by Investing.com. See disclosure here or remove ads .

The fact that the pattern is developing right after breaking the uptrend line since January 2019, reinforced by the 200 DMA, further indicates the 3,100 level is a red line between bears and bulls. We expect a downside breakout. If one does take place, we’d set our eyes on a repeated down-move equal in intensity to the one that preceded this façade of an equilibrium.

Trading Strategies

Conservative traders would wait for a second trough to form, establishing a downtrend, then wait for a pullback to retest resistance and confirm the downtrend.

Moderate traders are likely to jump in after a downside breakout, preferably on a closing basis.

Aggressive traders may risk a short now, since the price is at the top of the pattern, providing they understand the risk and write an appropriate plan that fits their budget.

Trade Sample - Short Setup

  • Entry: 3,130
  • Stop-Loss: 3,140, above yesterday’s high
  • Risk: 10 points
  • Target: 3,000
  • Reward: 130 points
  • Risk:Reward Ratio: 1:13

Latest comments

transports made a new low yesterday, so new lows likely here on the sp?
Nothing more stupid than placing an order with only with 10 pips S/L  95 % you will be stopped ... Opening a smaller position and putting your stop comfortably far away is much better !
"Trade sample"
maybe this month 2597 is where it will go
thank you for the info.!
You're welcome, Alberto!
hi
Risk Disclosure: Trading in financial instruments and/or cryptocurrencies involves high risks including the risk of losing some, or all, of your investment amount, and may not be suitable for all investors. Prices of cryptocurrencies are extremely volatile and may be affected by external factors such as financial, regulatory or political events. Trading on margin increases the financial risks.
Before deciding to trade in financial instrument or cryptocurrencies you should be fully informed of the risks and costs associated with trading the financial markets, carefully consider your investment objectives, level of experience, and risk appetite, and seek professional advice where needed.
Fusion Media would like to remind you that the data contained in this website is not necessarily real-time nor accurate. The data and prices on the website are not necessarily provided by any market or exchange, but may be provided by market makers, and so prices may not be accurate and may differ from the actual price at any given market, meaning prices are indicative and not appropriate for trading purposes. Fusion Media and any provider of the data contained in this website will not accept liability for any loss or damage as a result of your trading, or your reliance on the information contained within this website.
It is prohibited to use, store, reproduce, display, modify, transmit or distribute the data contained in this website without the explicit prior written permission of Fusion Media and/or the data provider. All intellectual property rights are reserved by the providers and/or the exchange providing the data contained in this website.
Fusion Media may be compensated by the advertisers that appear on the website, based on your interaction with the advertisements or advertisers.
© 2007-2024 - Fusion Media Limited. All Rights Reserved.