Micron shares soar on very strong guidance amid AI-led memory demand
By Pinchas Cohen
Salesforce outperformed the S&P 500 4:1 this year. A fact that many an investor would have killed to know a year ago. Salesforce is ranked as the most innovative company by Forbes – its 7th consecutive year in the top 25 and its 5th consecutive year in the top spot.
But let’s talk about the elephant in the room. The market rewarded companies for being innovative in the late 90’s. We all know how that ended. Valuations have only been this high twice in history – 1929 and 2000. We all know how those ended. Goldman Sachs landed a bomb when comparing the valuations of big tech companies to those of the pre-2000 crash, in a report on June 9. Nervous investors dumped tech stocks, which led the NASDAQ 100 Technology to fall 7.5-percent in the following 3-weeks. The index has not been able to recuperate since and is now 5-percent lower than the June 8 closing price, before the release of the report.
However, there is a decisive distinction. While in 2000 tech companies were rewarded for being innovative irrespective of revenue, or lack thereof, Salesforce revenue have consistently climbed since it went public on June 2004 and introduced the revolutionary concept of cloud software, which now approaches $4 billion in annual revenue.
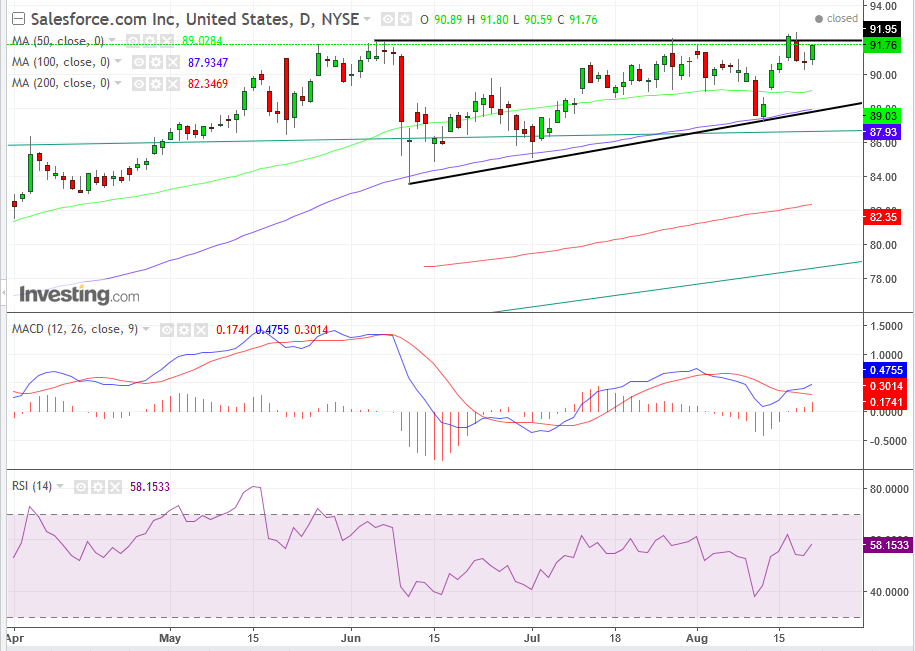
Salesforce is also outperforming the NASDAQ 100 Technology index. While it dropped harder and faster than the index, losing 8.3-percent in value in just two days, it immediately rebounded and is now actually higher with yesterday’s $91.76 closing price than the June 8, $91.25 closing price. Nor has its rebound register any overheating on either the MACD or the RSI, as they are in mid-range, after having been oversold before the Goldman Sachs report.
However, life is never simple. Fundamentally, even bulls are now concerned ahead of today’s after-market release. While Wall-Street is projecting a $0.32 EPS on a $2.52 billion average revenue, the company is expected to report a deferred revenue balance, which means that they have received payments for services not yet provided. In other words, a liability.

Perhaps that’s why sellers outweigh buyers at the $92 level, the pre-Goldman Sachs report highs. This trading behavior can be caused by any combination of three motives:
- Bulls have been unwilling to bid up the price higher than the June peak before they see the report
- Bears don’t believe earnings will warrant higher price, and/or
- “Informed money” already has an idea what the report will include, or should include, and those are the ones that are dumping the stock and creating resistance at $92
While, the price may in fact decline in the short term, its trajectory is up in the medium to long-term. So, if you feel left out from the stock’s 4:1 S&P 500 outperformance, you can get on at the next stop, if you would have been willing to hold onto the stock for the same duration the first time around.
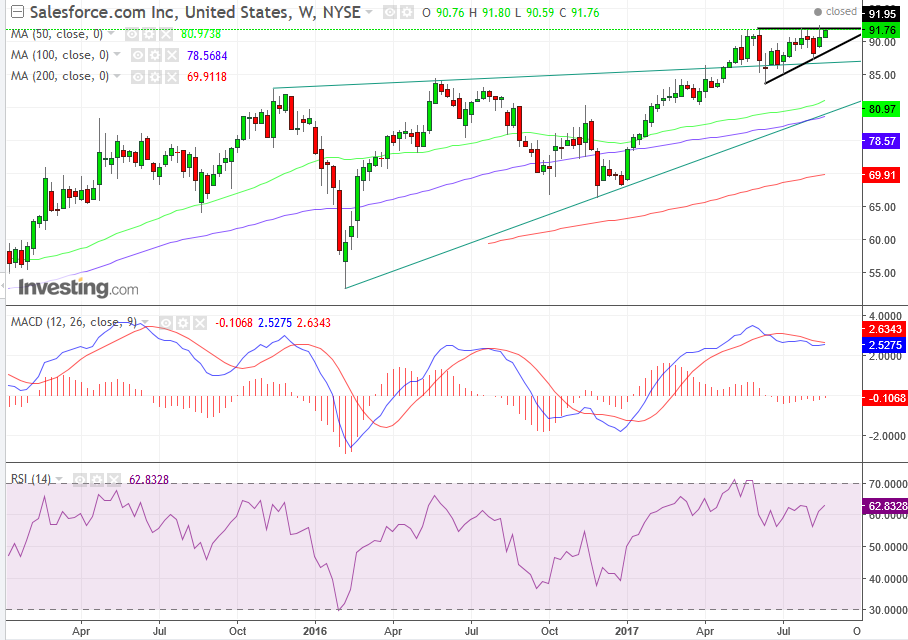
That Goldman Sachs report pushed the price into a trading pattern in the shape of an “ascending triangle,” in which buyers are gaining ground, as they are more eager than the sellers. While buyers are willing to buy at ever higher prices – starting with $84 in June, to resume with $85 in July and up to $89 in August – sellers are willing to sell only at the $92 level.
At this rate, buyers' rising appetite will buy all the available stock at this price level and leap to the next batch of sale orders at higher price levels. When that happens, it will provide an upside breakout to the triangle, forming a new dynamic, attracting more buyers and converting some sellers.

This course of action is indicated by a larger pattern – not one that worked but one that failed. Between November 2015 and April 2017, the price was traded within a bearish rising wedge pattern, but instead of breaking to the downside, it broke to the upside – indicating a reversal in psychology and a newfound optimism among investors. Should the ascending triangle complete with the upside breakout, it should have a much larger windfall – not just due to its own dynamic propelling it higher but to that of the 17-month, $30 bearish rising wedge pattern – depth wind at its back.
The only damper in this projection is sell signals by the weekly MACD and RSI. However, all the stars seldom – if ever – align, and we are relying on price trends and support-and-resistance over moving average interplays and momentum.
Trading Strategies
Conservative traders should wait for a decisive advance – from 1 to 3 percent, depending on your risk aversion – before entering on a long position. Even then, they may wait for a common return move to retest the support of the pattern or enter after the breakout if they can afford to place a stop loss beneath the pattern top.
Moderate traders should wait for a clear close above the pattern of at least 1 percent, or for 2 or 3 days of closes above the pattern, before entering a long position.
Aggressive traders may short now – counting on the deferred revenues, the resistance at $92 and the oversold weekly MACD and RSI sell-signals – and turn around at the $90 price level with a long, or then wait for an upside breakout, depending on their risk aversion.
Amateur traders would enter trades with no strict money management system. They would run with their losses – in a misled notion of avoiding realizing a loss and with the irrational faith of a presumed inevitable turn-around – while they cut their losses short, before waiting for the trade’s maturity, to give themselves a chance to have a few big wins to cover many small losses. These traders pride themselves on being aggressive traders, but professional, aggressive traders don’t enter trades in which the potential growth outweighs the potential risk. They also know that not allowing their winning trades a chance to make up for their losing trades is a losing proposition.
