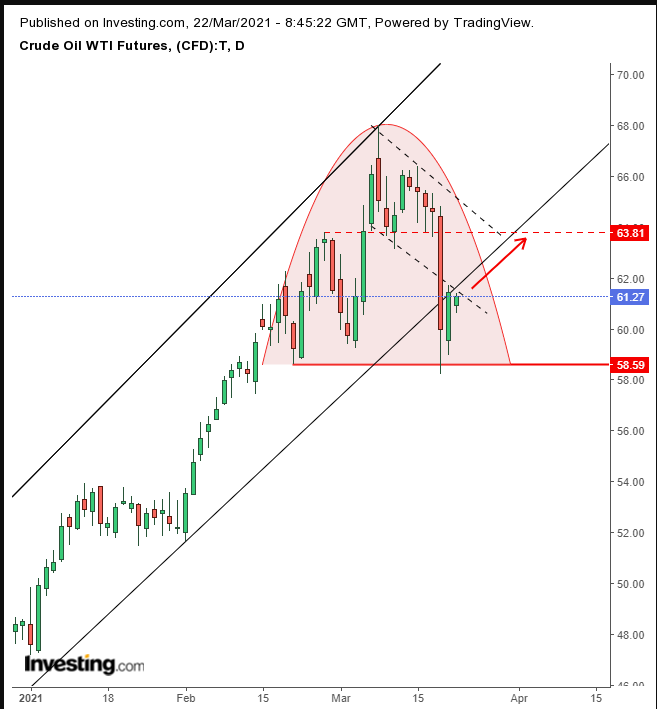
It looks as though oil market expectations might be changing. The headwinds that propelled prices higher appear to be dissipating. That means potentially, the commodity's price could be about to top out.
The OPEC+ decision to keep in place production cuts triggered by the pandemic surprised traders and boosted optimism that the massive stimulus, together with the vaccine rollout, would lift demand for oil. This mix of circumstances spurred the fundamental conditions that fueled the largest number of net long positions in WTI since 2018. These positions have been building since the first positive vaccine results in early November, which caused the price to bottom at that time.
However, recent Fed dovishness has sucked some of the wind out of the inflation argument. The world’s largest importer, China, has been reducing demand, even as US inventories have been building. The International Energy Agency recently dispelled the argument for a new supercycle for oil, saying there is sufficient supply to meet demand.
As if that weren't enough to drive the price lower, lingering coronavirus concerns and worries over vaccine safety in Europe— the very themes that ignited this uptrend—have dented it further. Finally, the rising dollar in which oil is denominated, makes crude more costly, further weighing on demand.
Furthermore, the falling flag we identified last week is no longer a bullish signal.

That flag was set to continue the underlying uptrend. However, the IEA announcement acted as a bucket of cold water on what now appears to have been an overheating market. It seems conditions were rising too much and too fast, which may have allowed trader complacency to set in.
The drop that followed last Thursday's announcement, a whopping 7.1%, was the single biggest daily selloff since April 2020.
That plunge blew out the bullish implications of the flag. The sharp selloff appears to have been the rapid liquidation of long positions. The price, however, found support by the February lows, closing well off those lows.
The price rebounded from that point on Friday, but found resistance precisely where the failed flag and the underside of the failed uptrend line/rising channel bottom meet. Today’s price retested that technical juncture below $62 and was pushed back.
We now expect a bull-bear struggle, between reflation bet dip-buyers and those liquidating—if not outright short-selling—their positions. The technical path allows for the price to rise again, as it attempts to climb back into the upstream of the rising channel.
However, absent any fundamental changes, we predict the price will likely find resistance at the $64 area, matching the same resistance encountered during the late February highs, setting the stage for a H&S top.
Note: the pattern is complete only upon a decisive downside breakout of the neckline, where the price lows meet, at the $58 level.
Trading Strategies – Short Position Setup
Conservative traders should wait for a conspicuous downside breakout, with an at least 3% penetration to $56.75, during a three-day period, preferably to include a weekend, then wait for a return move that would evidence resistance by the neckline.
Moderate traders could short after at least a 2% downside breakout to $57.40, followed by a corrective rally, as shorts cover and dip buyers fight the short-term trend, for a better entry, if not for further proof of a reversal, during at least a two-day period.
Aggressive traders would short when the price reaches the $64 level and demonstrates resistance, counting on the continued development of the pattern, or upon at least a 1% neckline penetration on a closing basis. The more aggressive the position, the more important money management becomes.
Here’s an example:
Trade Sample 1 – Predicting H&S Breakout
- Entry: $63.80
- Stop-Loss: $64.80
- Risk: $1
- Target: $58.80
- Reward: $5
- Risk:Reward Ratio: 1:5
Trade Sample 2 – Pattern Completion
- Entry: $58
- Stop-Loss: $59
- Risk: $1
- Target: $52
- Reward: $6
- Risk:Reward Ratio: 1:6
Author's Note: The above are samples, not the full analysis. Trading on them alone is like following driving instructions without understanding the road signs. The samples provide two basic scenarios among many that can occur. The more you understand the analysis the better the trading decisions you can make so that they are suited to your timing, budget and temperament. We do not claim to know the future, and say up front that this post is just our opinion.
If you just took a trade and it didn't work out, please spare us the rude comments. You gambled. Until you learn how to customize trades to your needs and abilities, take small risks for the purpose of learning, not for profit. If you don't understand the full analysis and how to trade it, there this is one future we do know: you'll lose all your money.
