By Pinchas Cohen
We’ve discussed at length the ways in which market structure has broken down since the US elections. We've pointed out that equities, gold and bonds shouldn’t all rise in tandem. Equities rise on business growth; gold and bonds rise on both lower interest rates and risk-off sentiment, both of which are contrary to a stronger business climate.
The one asset we haven’t mentioned here, but which has become a central player, often focused on by the financial media right now, is the US dollar. The reason we haven't included it as one of the responsive assets listed above is because it is in fact the asset that is driving the responses of the other vehicles.
It's the glue in the current investment landscape. Perhaps, it is no longer the glue but rather the agent of destruction. The catalyst that has been breaking the longstanding, reliable market structure, leaving so many great analysts and money managers at a loss—for both words and profits.
We have also analyzed at length the reasons for the dollar’s prolonged decline, both economically and politically.
Since Donald Trump came to power, whether deliberately or not, it's no secret the dollar has had a target on its green back after he claimed that the strong dollar was killing the US. After he said that, the dollar began its descent; his actions continued to pummel the currency further, pushing it even lower.
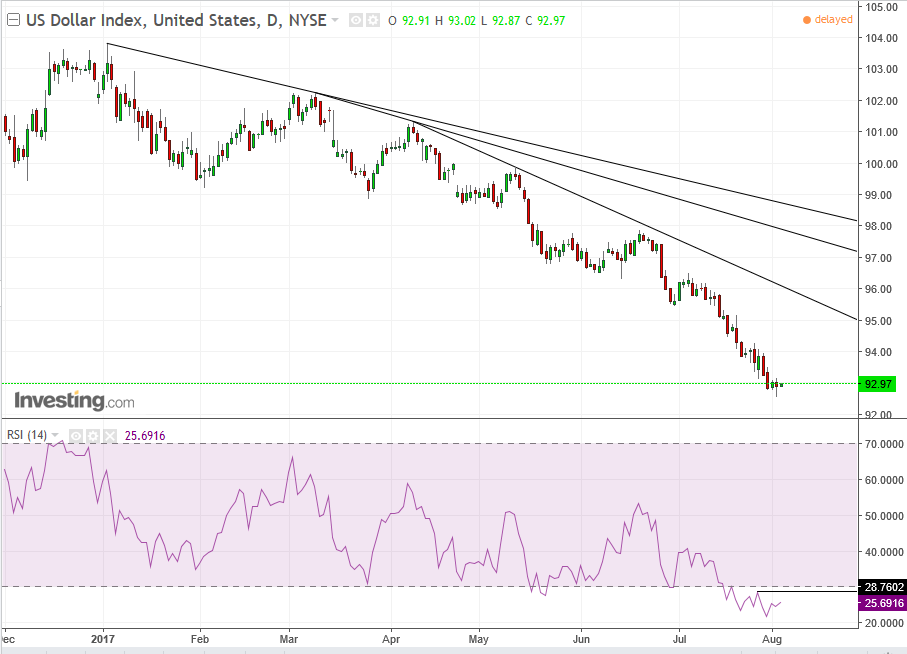
The dollar’s 3.2 percent decline in the second quarter boosted sales for multinational companies, whose earnings have been driving the unprecedented prices we’ve been seeing in US stock indexes, even while the US economy keeps disappointing, and the country's political fabric keeps getting shredded, even though it has proven to be elastic thus far.
Weaker Dollar Boosts Previously Bearish Assets
The weaker dollar has been propping up commodities, including often discussed oil, though the global glut is showing few signs of abating. Industrial metals have surged to the highest since 2015, led by copper and iron ore. Naturally, this has attracted many equity investors to the energy and metals sectors, each of which has had a strong hand in these record rallies.
Bonds have been boosted as well, both by the slower interest rate path which is making today’s rates more attractive as well as by attracting foreign investment, where local bonds are being sold off on a growing economy and rising local currencies.
Strongest Support Since 2013 Peaks
Technically, the dollar reached its strongest support since the 2013 peaks, as it makes its lowest trough since 2014 – which is the lowest price of the 2.5-year range - the 91.92 early May low.
If you need further evidence of this important price level, look what just showed up...the 200 dma. The last time the price touched the 200 dma was May 2014, and the dollar index surged 26-percent in the following ten months, till March 2015.
The near 11-percent plunge in the dollar since December, after Trump's “killing us” remark, drove the index into its most oversold condition since March 2008. For momentum traders, this is a once-in-a-decade opportunity.
Even if you’re bearish on the dollar, beware of a dead-cat bounce, in which dip-traders buy on asset irrespective of its fundamental value or technical environment. The fact that it has actually reached its lowest price since May 2015, which is also the lowest since January 2015, “guarded” by the 200 dma provides the technical framework for a long trade to boot.
A Dollar Breakdown Versus Majors
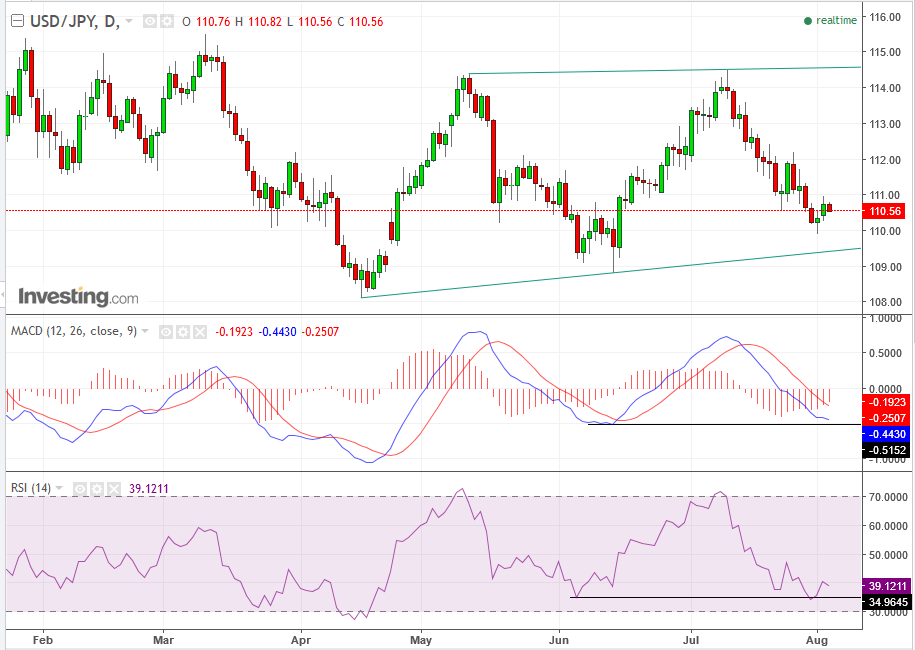
The most talked about pair this year has been the USDJPY, as it signaled shifts in risk and even quantified them. The pair has neared an uptrend line since April 17 and bounced, with the MACD and the RSI confirming support. A red flag is waving for the pair, over the long run, on account of the inability of the July peak to rise higher than the May peak.
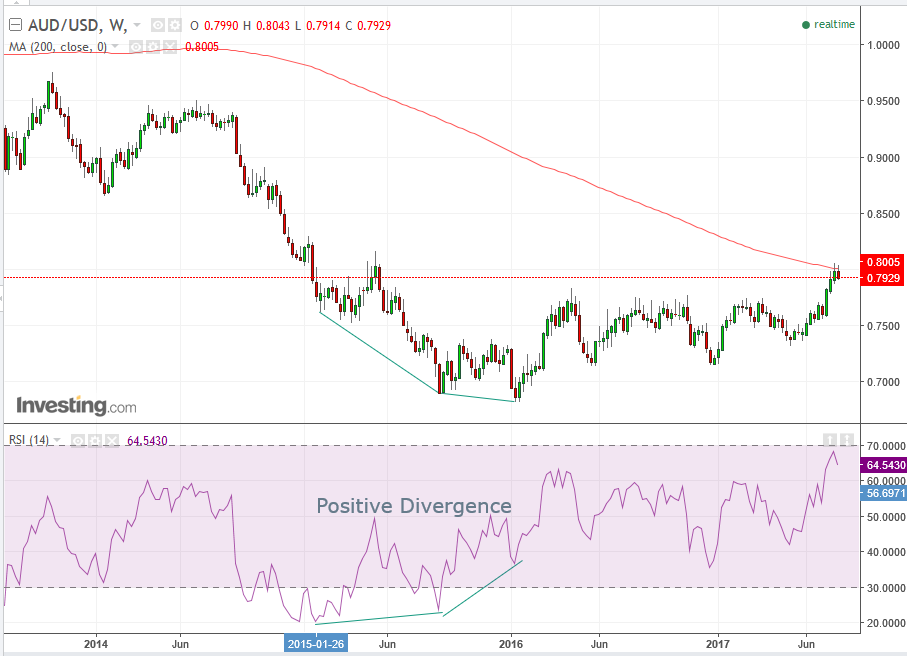
The AUDUSD got stopped by the 200-week average, though it has overcome the congestion that's been in effect for more than a year. Note the positive divergences that gave a heads-up to the pair’s reversal. However, for now, the pair must contend with the major moving average and a sell signal by the RSI, after an overbought condition—highest since 2011—slowed momentum.
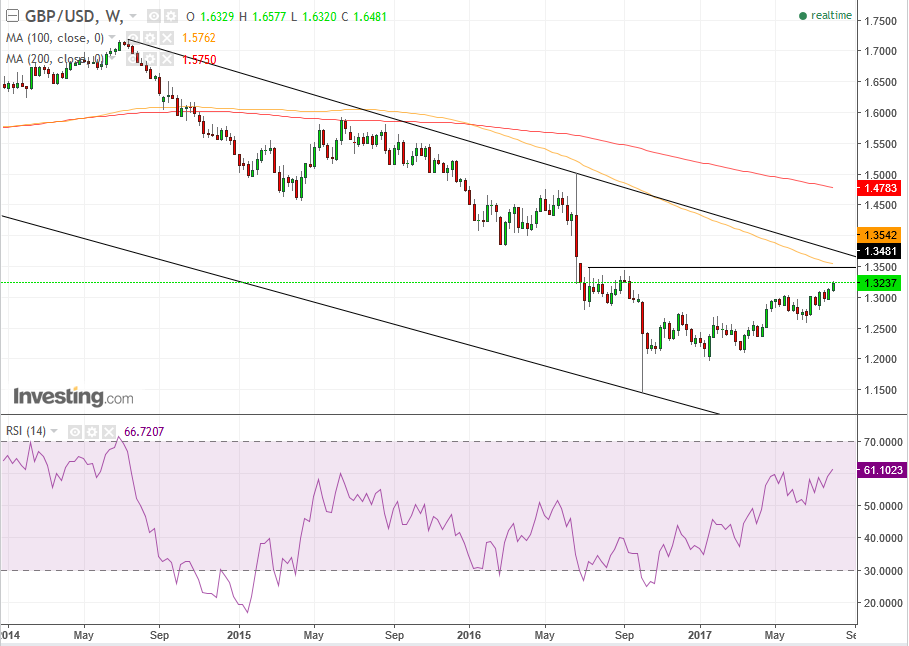
The pound is reaching a confluence of resistances, between its falling channel top since mid-2014, its resistance of insurmountable prices since mid-2016 and a rushing 100 week moving average, to signify its significance. Note how the RSI is not rising along with the price, showing momentum is weaker compared to the previous rally, which may signify an end to the upward correction.
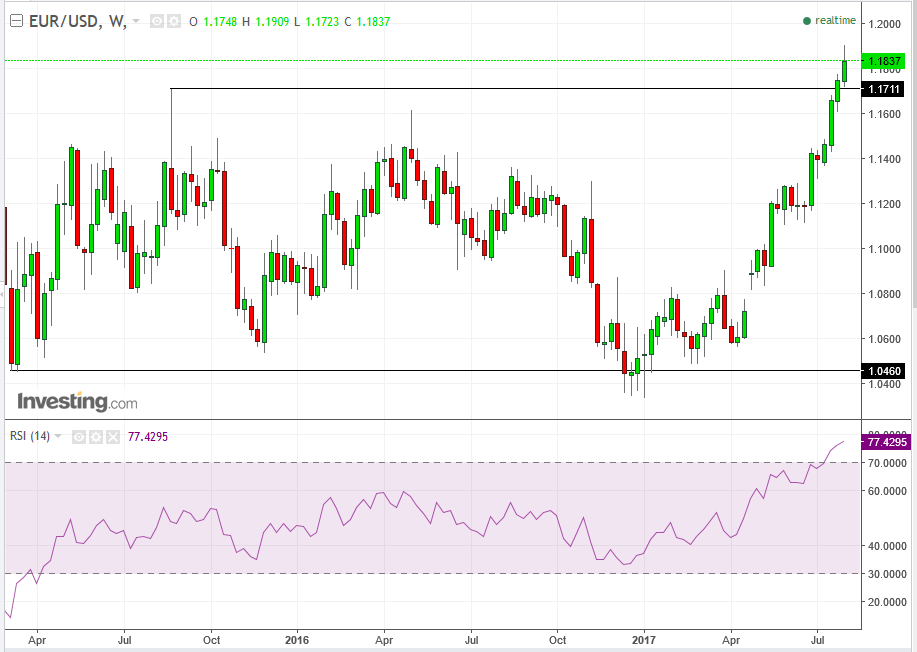
The EUR/USD pair broke out of a 2.5-year range lock-up, in which it had been trading between roughly 1.05 and 1.15. And what do escaped prisoners do? That’s right, they head for the hills.
The momentum dynamics of such shifting trading trends generally replicate the same environment to the new direction, putting the pair's sights on 1.3. But for now, the pair has reached its most oversold condition since November 2017. This is significant considering that was just before the euro sold off in favor of the dollar, as the 2008 crash safe haven. As such, the euro may at least take a breather for now.
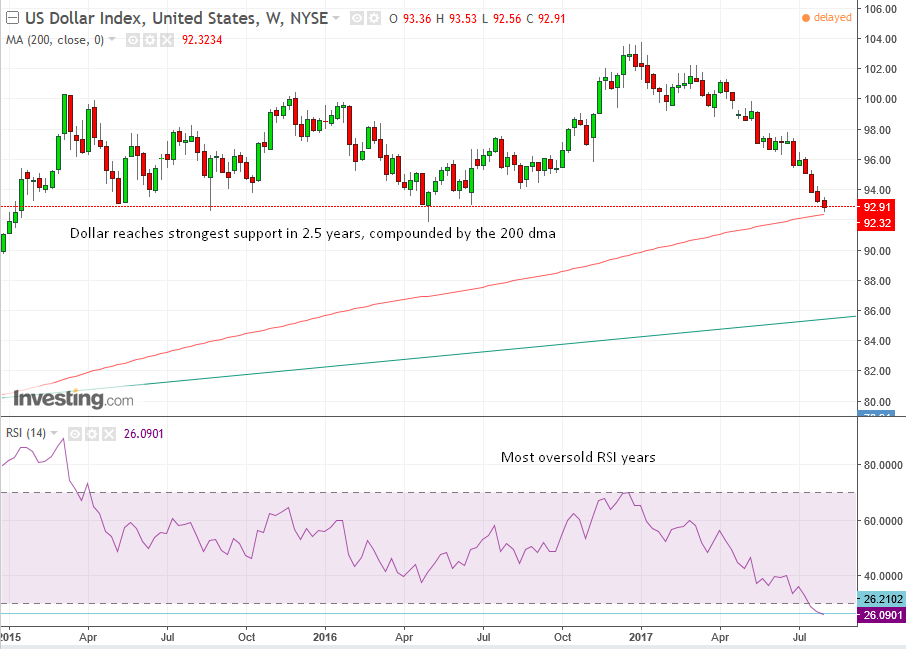
The dollar index has reached the lowest price since the first week of May 2016. More important than the length of time is the fact that it’s the lowest price in the last 2.5 years, making it the last support before a potential plunge to the 2013 peak support of 85.00.
In testament to the importance of this price level, the 200 wma showed up, to lend a helping hand. The RSI is the most oversold since March 2010. This provides a long opportunity, on a bounce, at the very least. If it breaks this support, we’d turn around with a short.
Trading Strategies
Conservative traders would wait on a long, either for a dip to the 200-week average, at 92.32, or alternatively for a rise to create a buy signal on the RSI, with it climbing back over 30.
Moderate traders may wait on a long, either for a dip to yesterday’s 92.56 low, or alternatively for a rise which would trigger an RSI buy signal, when it overcomes its previous 26.21 peak, preferably at a close.
Aggressive traders might go on a long now.
Targets:
- 94.00 – the price couldn’t overcome it between July 24 and July 28, before it declined further, demonstrating sellers at that price level.
- 95.00 – psychological round number, which can be demonstrated in prices finding support there on June 30, and after breaking it on July 18, finding a resistance there on July 20. As well, the most recent, steepest downtrend line since April 10 is expected to meet that price level
- 97.25, the former June 20 peak.
Disclaimer: Stop losses should be placed according to the trader’s risk level, per the provided key prices.
