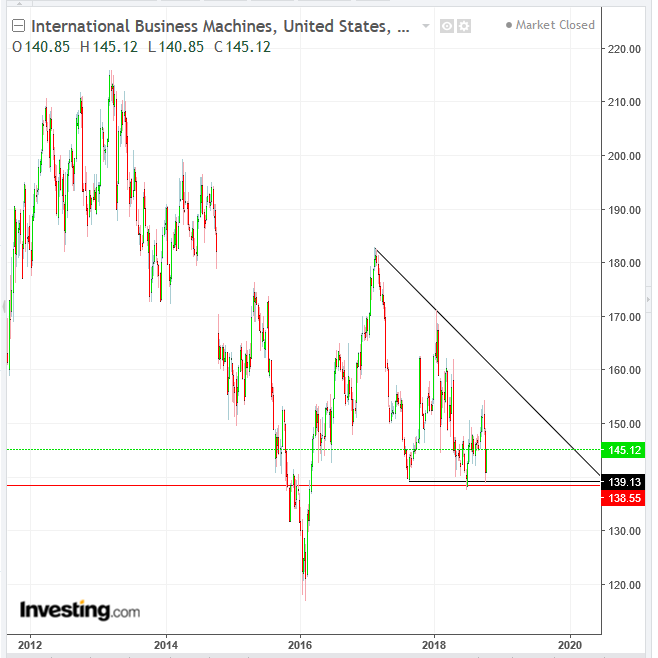
International Business Machines (NYSE:IBM) disappointed markets yesterday when it missed on revenues. The weaker than expected results sent shares of IBM down about 5%.
In particular, IBM reported a slowdown of mainframe servers and data storage systems, once considered the company's bread-and-butter. This key metric fell from 25 percent to a mere 1 percent QoQ.
With many other tech sector stocks flying high—especially Netflix (NASDAQ:NFLX) which yesterday beat on its key metrics, after which shares rallied as much as 14 percent, up 81.91 percent for 2018 so far—IBM shares are becoming a tougher and tougher sell. The stock is already down 5.41 percent YoY. Yesterday's disappointment could be the last straw for Big Blue loyalists.

As of 5:37 EDT, IBM's share price is down $6.58 to $138.54, a 4.53 loss. That would bring the stock price (red line) below the bottom of an enormous descending channel since February. The pattern demonstrates the outpacing of supply over demand. While investors have been willing to sell at ever lower prices, buyers were not as committed to rallies.
Seller offers fell steadily, from $180 in early 2017 to above $170 early this year. By this month, sellers were happy to receive just under $155 per share. Buyers made bids only below $140 since the 43.5 percent plunge in the six months earlier in the year.
Yesterday’s disappointment could be the final straw that breaks buyers' backs, which would allow the price to fall below the pattern. When sellers fail to find willing buyers above the $140 level, they will be forced to lower their offers, in order to find willing buyers at lower prices. The lower offers are expected to trigger stop-losses, removing even more buyers from the equation.
Finally, speculators will probably jump on the opportunity to short the stock, adding even more pressure to the stock.
Trading Strategies – Short Position Setup
Conservative traders should wait for a decisive downside breakout, employing a filter that should include at least a three percent penetration and a three day rule, in which prices remain below the pattern. The penetration should be measured from the June 27 low at $137.45.
A Friday close would be even more conservative, as it demonstrates investor certainty over their position, with which they are stuck over the weekend. Then, they will wait for a return-move to retest the resistance of the triangle bottom when the prices fall below the initial breakout penetration of $135.
Trade Sample:
- Entry: $135, after the filter and a successful return-move as instructed above.
- Stop-loss: $140, round psychological number above the pattern bottom.
- Risk: $5
- Target: $120
- Reward: $15
- Risk-Reward Ratio: 1:3
Moderate traders will wait for a two percent filter to $136 and a two day period during which time an oversupply would keep the price below the triangle bottom, followed by a return-move to retest the pattern’s integrity, demonstrated when the prices fall back below its moderate, two percent penetration of $136.50.
Trade Sample:
- Entry: $136, after the filter and return-move
- Stop-loss: $140, round psychological number above the pattern bottom
- Risk: $4
- Target: $120
- Reward: $16
- Risk-Reward Ratio: 1:4
Aggressive traders may risk a short position with just a one percent filter to $138 and a single day period, in which the price would remain below the pattern, followed by a return-move to confirm resistance when the price falls back below the one percent penetration point of $137.70.
- Entry: $137
- Stop-loss: $140, round psychological number above the pattern bottom.
- Risk: $3
- Target: $120
- Reward: $17
- Risk-Reward Ratio: 1:5
