How Will "America First" Impact The Dollar?
On January 17, 2017, President Donald Trump told The Wall Street Journal in an interview, “Our dollar is too strong…and it’s killing us.” In the following months, his administration reiterated that sentiment, while also going on the offensive against countries around the world including China, Germany and Japan, accusing them of currency manipulation, rendering an artificially stronger dollar, making US exports less competitive on the world stage.
From the $101.54 opening price on the day of that Wall Street interview through today the dollar has fallen 12 percent. Yesterday, as Trump set out to join a global initiative for globalization and free trade at Davos, the president and his administration started round two of “America First," tweeting that he was ready "to tell the world how great America is..."
This raises the question: How will the America First approach impact the dollar in 2018?

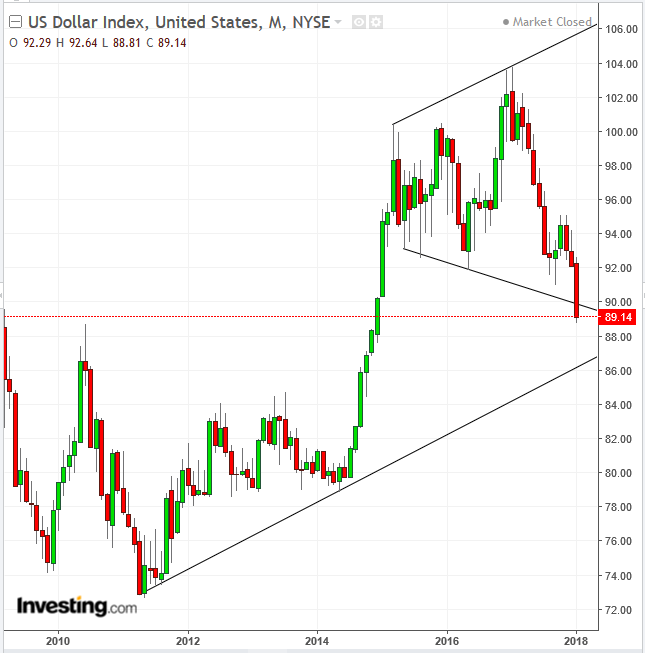
Since May 2011, the dollar index had been rising from the 73.00 level, until it reached its highest level just under 104.00 on that fateful January day right before Trump’s “it’s killing us” interview.
However, in reality the dollar index had been struggling much earlier than that. After a straight 9-month advance, when it clocked an unheard of 25% percent increase from 80.00 to over 100.00, the dollar was out of steam. Following that, the dollar was range bound from April 2015 through November 2016 when Trump won the election. The greenback then hit the longest advance and biggest gain of the range: three straight months, when it rose 8 percent in value.
The double digit decline that followed kept the dollar trapped in that range, while the ever-widening swings shaped it into a Broadening Pattern.
Dollar Trapped By Irrational Supply/Demand Balance
This pattern demonstrates the irrational supply-demand balance throughout the range. A rising market is possible when both buyers and seller agree on the trend, as they both buy and sell the asset in the same direction, at ever rising prices. Alternatively (but following the same rationale) a falling market emerges when buyers and sellers are in agreement, as they both buy and sell the asset in the same direction, at continuously lower prices. When a Broadening Pattern develops, however, it demonstrates the emergence of a breakdown of market structure, where buyers and sellers are not in agreement, not only with each other, but even with themselves.
Why would buyers buy an asset – each time at a lower price – if they expect it to fall (the buying/support line is in decline, i.e., the pattern bottom)? Why would sellers sell an asset – each time at a higher price – if they expect it to rise (the selling/resistance line is rising, i.e., the pattern top)? This demonstrates a lack of a coherent strategy. Therefore, this pattern develops at market tops.
However, this pattern almost always develops over months, not years like it did in this case. Except for the Dow Jones Industrial Average price, which developed a Broadening Pattern between 2000 and 2016, I have never seen this pattern over a span of years before, until now. Therefore, there is no data with which to draw a statistically reliable conclusion. So proceed with caution, according to the parameters set below in the trading strategy section. Note, traders may trade during shorter periods for smaller moves, within the broad parameters set forth.
The price has just dipped below the pattern bottom, potentially completing a breakout. The rising channel since May 2011 would be a test to the breakout validity.
Should the breakout clear the uptrend line, we could expect another double-digit percent fall, like that of last year.
Trading Strategy – Long-Term Short
Conservative traders would probably wait for a clear break below the uptrend line since May 2011, with a full candle below it; then, wait for a return move, which would validate the resistance of the broken uptrend line.
Moderate traders would wait for a cross below the uptrend line and then may wait for a return move to enter at a price closer to the resistance for a better risk-reward ratio but not necessarily for evidence of the presumed resistance by the broken uptrend line.
Aggressive traders might chance a short with at least a close beneath the broadening pattern – with the uptrend line as the target – provided they are prepared for a bear trap.
